我会使用LaTeX生成表格,因为它们看起来很漂亮,你可以生成图像或直接将它们放在你的文档中。我用以下代码实现了这个目标:
import numpy as np
import os
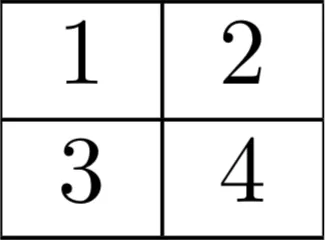
x = np.array([[1,2],[3,4]])
def generateLatexTable(x):
start = [r'\documentclass[preview]{standalone}', r'\begin{document}', r'\begin{tabular}{%s}' % ('{1}{0}{1}'.format('|'.join(['r'] * x.shape[1]), '|')), r'\hline']
tab = [' & '.join(['%d' % val for val in row]) + r' \\ \hline' for row in x]
end = [r'\end{tabular}', r'\end{document}']
text = '\n'.join(start + tab + end)
return text
with open('table.tex', 'w') as f:
f.write(generateLatexTable(x))
os.system("pdflatex table.tex")
这里使用文档类{{preview}},返回一个调整为文档内容大小的图像,即仅表格。只使用{{tabular}}环境来呈现数据。单元格之间有水平和垂直线条,但很容易更改。在变量{{tab}}中,对每一行的数据进行处理并转换为字符串。请注意,您必须在此位置指定输出格式。我将其设置为{{%d}},因此所有内容都将转换为整数。
如果要直接在latex源中使用该表格,则必须从{{start}}和{{end}}变量中删除{{documentclass}}、{{\begin{document}}}以及{{\end{document}}}。最后,将所有内容组合成一个latex源代码,然后将其存储到磁盘上,命名为{{table.tex}}。如果您只想得到最终的图像,则编译生成的文件为{{table.pdf}}。
以下是输出结果的样子。但正如我所说,非常容易更改外观,因为它是LaTeX :)
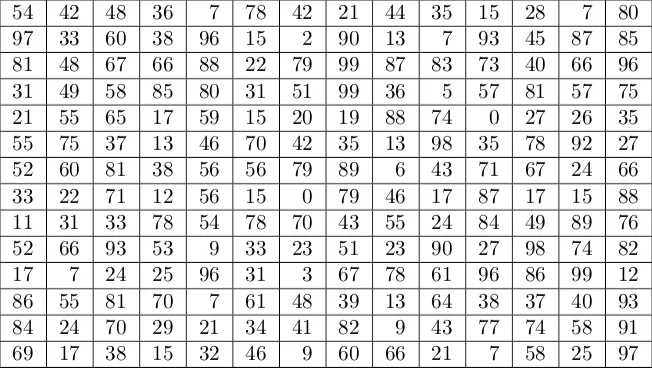
以下是另一个示例,使用一个14 x 14的大矩阵,其中填充了从0到100的随机数:

table是一个不错的起点。我还没有使用它足够多,无法给出一个好的答案。 - Warren Weckessertable。 - Warren Weckesser