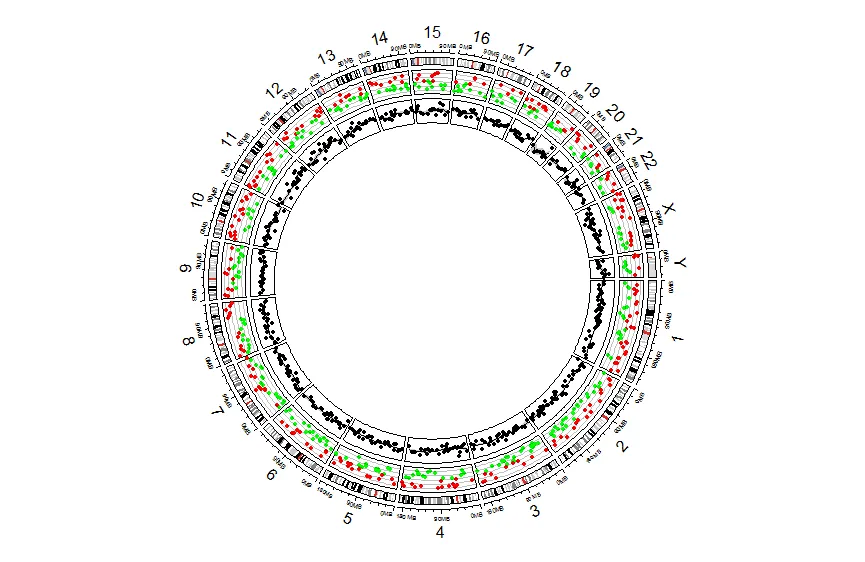
使用 R 中的 "circlize" 包,我正在尝试为每个轨道添加标签。在下面的示例中,我希望在扇区
Y 和扇区 1 之间显示 "A. Ideogram"、"B. Expression" 和 "C: Count"。library(circlize)
circos.initializeWithIdeogram()
bed = generateRandomBed(nr = 500, fun = function(k) runif(k)*sample(c(-1, 1), k, replace = TRUE))
circos.genomicTrackPlotRegion(bed, ylim = c(-1, 1), panel.fun = function(region, value, ...) {
col = ifelse(value[[1]] > 0, "red", "green")
circos.genomicPoints(region, value, col = col, cex = 0.5, pch = 16)
cell.xlim = get.cell.meta.data("cell.xlim")
for(h in c(-1, -0.5, 0, 0.5, 1)) {
circos.lines(cell.xlim, c(h, h), col = "#00000040")
}
}, track.height = 0.1)
bed = generateRandomBed(nr = 500, fun = function(k) rnorm(k, 0, 50))
circos.genomicTrackPlotRegion(bed, panel.fun = function(region, value, ...) {
x = (region[[2]] + region[[1]]) / 2
y = value[[1]]
loess.fit = loess(y ~ x)
loess.predict = predict(loess.fit, x, se = TRUE)
d1 = c(x, rev(x))
d2 = c(loess.predict$fit + loess.predict$se.fit, rev(loess.predict$fit - loess.predict$se.fit))
circos.polygon(d1, d2, col = "#CCCCCC", border = NA)
circos.points(x, y, pch = 16, cex = 0.5)
circos.lines(x, loess.predict$fit)
}, track.height = 0.1)
circos.clear()
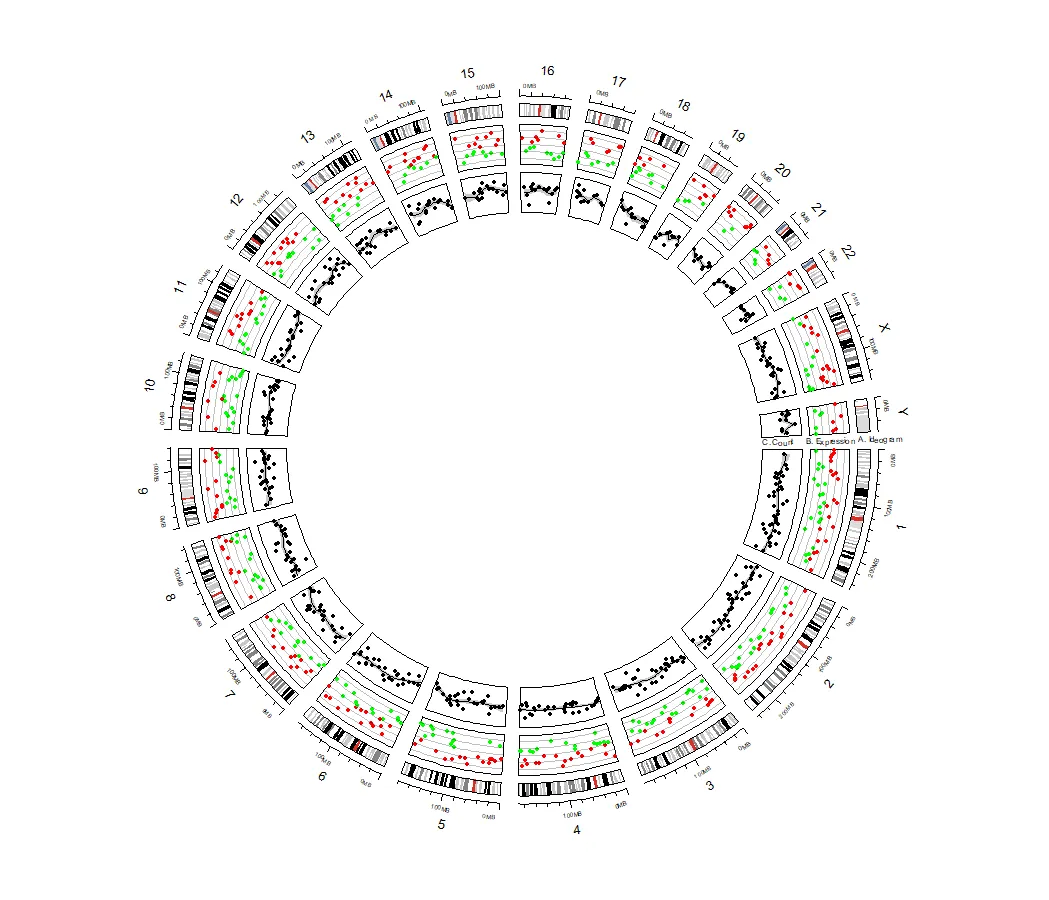
Y和1之间似乎没有空间。 - Cath