本地直方图均衡化

8

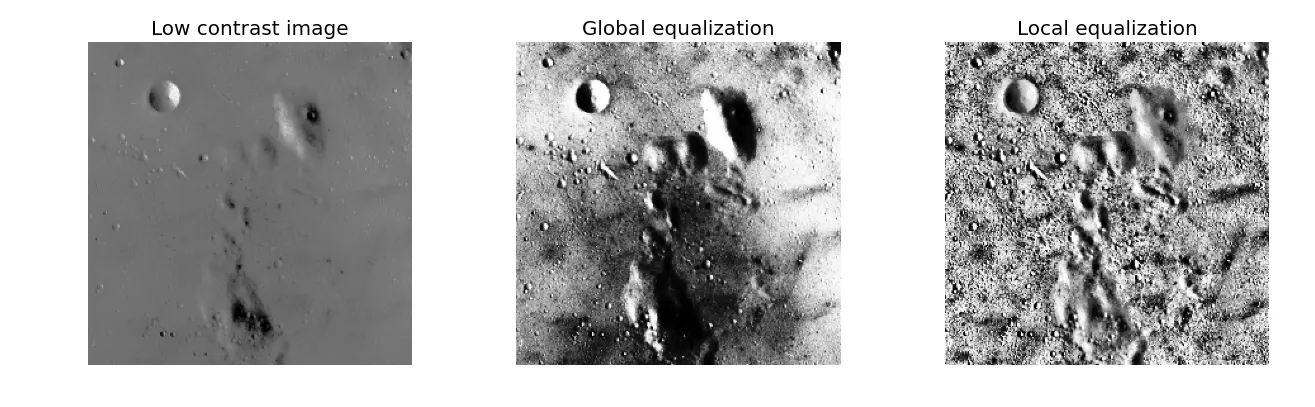
我正在尝试使用Python进行图像分析(必须使用Python)。我需要做全局和局部直方图均衡化。全局版本效果很好,但是使用7x7足迹的局部版本效果非常差。

这是全局版本:

   import matplotlib.pyplot as plt
   import matplotlib.image as mpimg
   from scipy  import ndimage,misc
   import scipy.io as io
   from scipy.misc import toimage
   import numpy as n
   import pylab as py
   from numpy import *

   mat = io.loadmat('image.mat')
   image=mat['imageD']

   def histeq(im,nbr_bins=256):
     #get image histogram
     imhist,bins = histogram(im.flatten(),nbr_bins,normed=True)
     cdf = imhist.cumsum() #cumulative distribution function
     cdf = 0.6 * cdf / cdf[-1] #normalize
     #use linear interpolation of cdf to find new pixel values
     im2 = interp(im.flatten(),bins[:-1],cdf)
     #returns image and cumulative histogram used to map
     return im2.reshape(im.shape), cdf

   im=image
   im2,cdf = histeq(im)

为了做本地版本,我正在尝试使用通用过滤器,例如(使用先前加载的相同图像):
   def func(x):
     cdf=[]
     xhist,bins=histogram(x,256,normed=True)
     cdf = xhist.cumsum() 
     cdf = 0.6 * cdf / cdf[-1] 
     im_out = interp(x,bins[:-1],cdf)
     midval=interp(x[24],bins[:-1],cdf)
     return midval

 print im.shape
 im3=ndimage.filters.generic_filter(im, func,size=im.shape,footprint=n.ones((7,7)))

有没有人对为什么第二个版本不起作用有什么建议/想法?我真的卡住了,任何评论都将不胜感激!提前谢谢!


3
不确定这是否与7x7=49以及您使用了256个容器有关。 - Sleepyhead
我考虑过这个问题...我尝试使用49,但没有太大的改进。但我认为应该是256,因为累积分布函数应该是每个亮度值有多少像素的累积和,所以按像素值而不是像素数量进行分组是有意义的(我想是这样的?!)。感谢您的输入! - user3011255
@user3011255:如果你使用7个箱子会怎样? - Willem Van Onsem
1个回答

8
您可以使用scikit-image库进行全局和局部直方图均衡化。以下是代码段,摘自链接。采用圆形核(或足迹)进行均衡化,但您可以通过设置kernel = np.ones((N,M))来将其更改为正方形。
import numpy as np
import matplotlib
import matplotlib.pyplot as plt

from skimage import data
from skimage.util import img_as_ubyte
from skimage import exposure
import skimage.morphology as morp
from skimage.filters import rank

# Original image
img = img_as_ubyte(data.moon())

# Global equalize
img_global = exposure.equalize_hist(img)

# Local Equalization, disk shape kernel
# Better contrast with disk kernel but could be different
kernel = morp.disk(30)
img_local = rank.equalize(img, selem=kernel)

fig, (ax_img, ax_global, ax_local) = plt.subplots(1, 3)

ax_img.imshow(img, cmap=plt.cm.gray)
ax_img.set_title('Low contrast image')
ax_img.set_axis_off()

ax_global.imshow(img_global, cmap=plt.cm.gray)
ax_global.set_title('Global equalization')
ax_global.set_axis_off()

ax_local.imshow(img_local, cmap=plt.cm.gray)
ax_local.set_title('Local equalization')
ax_local.set_axis_off()

plt.show()

Results of equalization


网页内容由stack overflow 提供, 点击上面的
可以查看英文原文,
原文链接