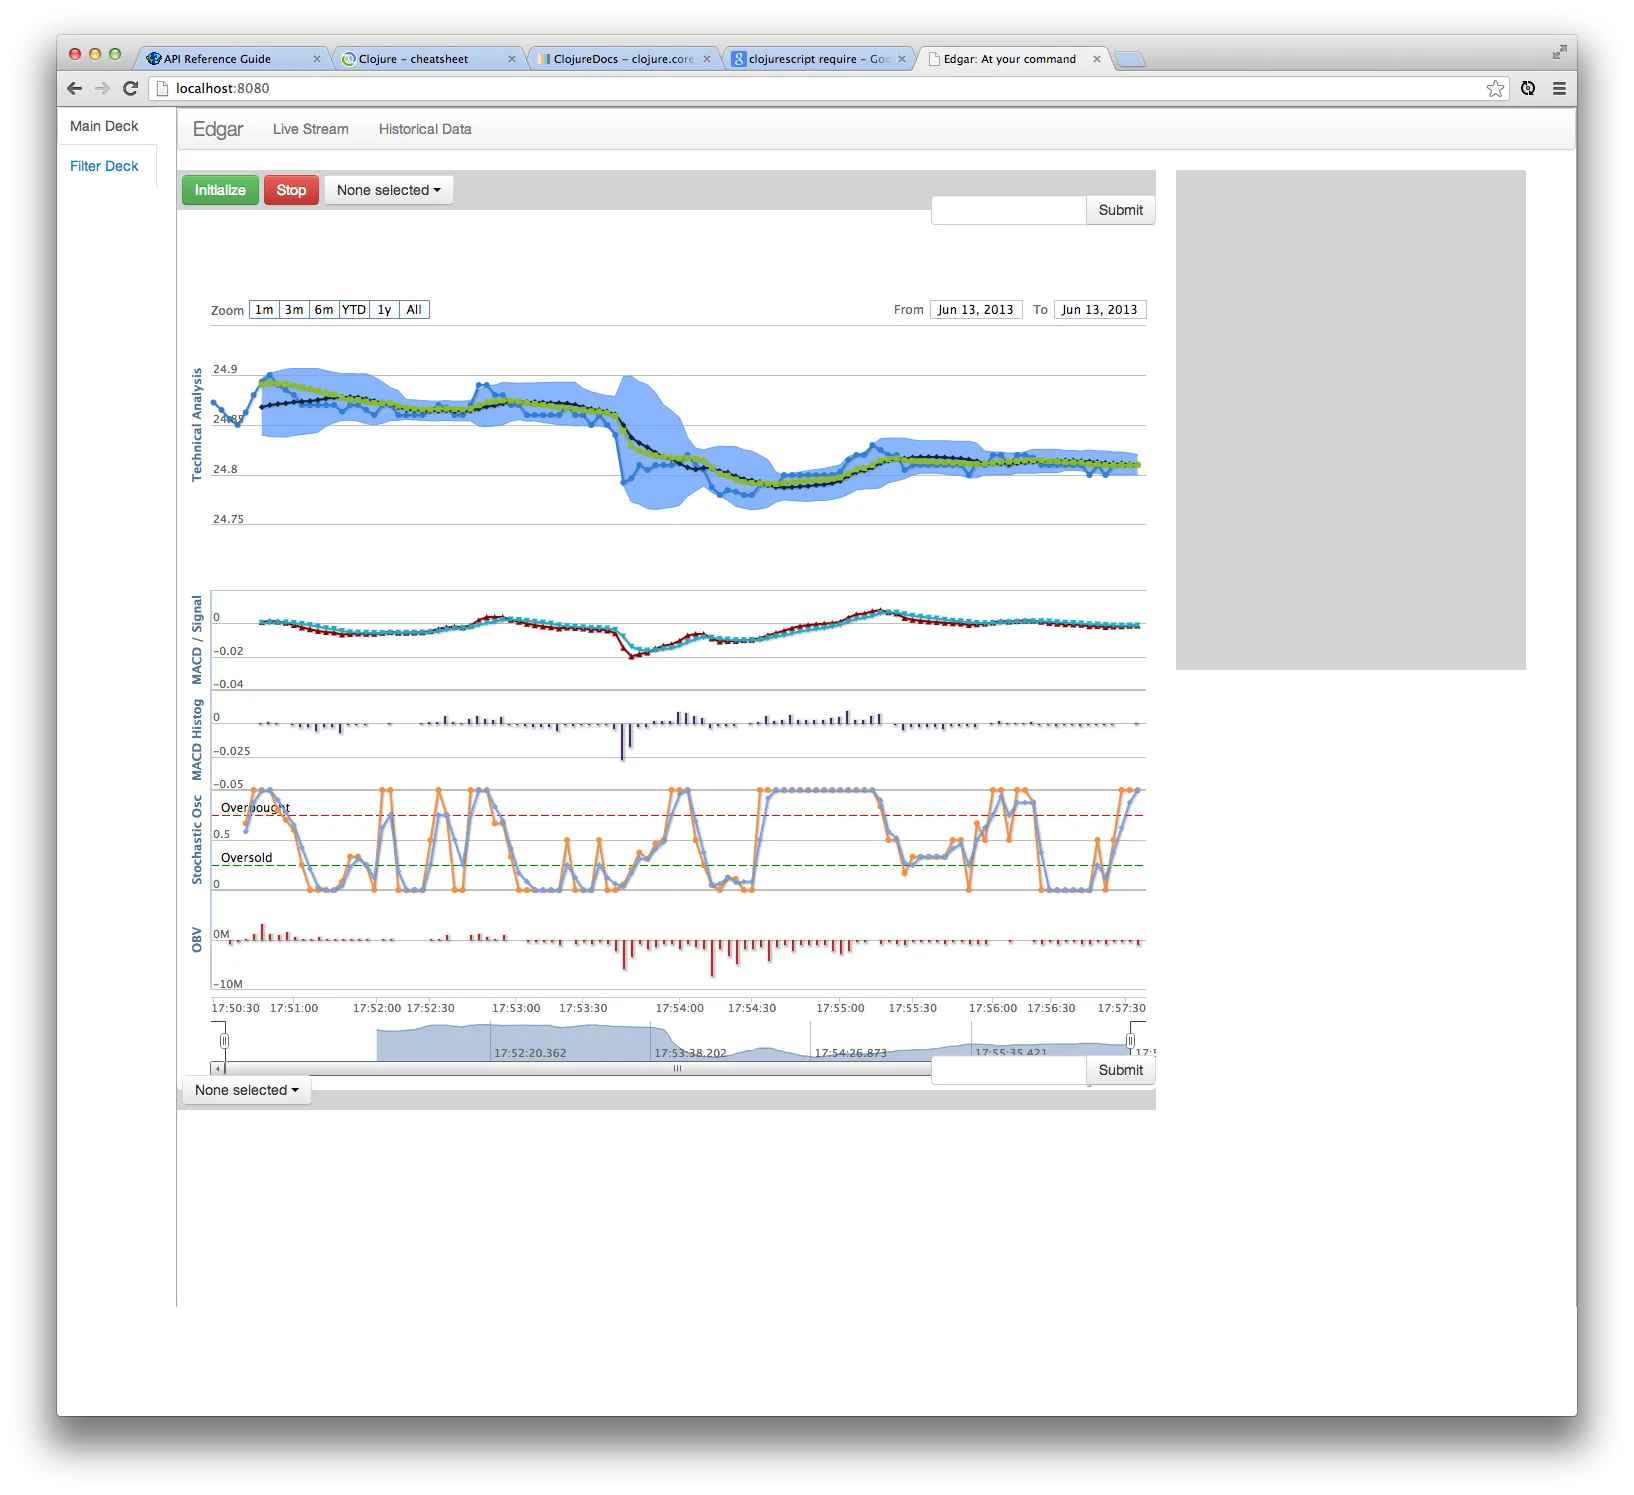
A) 我正在使用Highstock图表库来完成我的一个财务项目。然而,我遇到了性能问题。我的Highstock实现有i)一个图表中的5个图形ii)一个图形中的多条线(和不同类型的线)iii)应用于图形上点的标签iv)新数据每秒钟到达一次,添加一个点并向左动画化图形。然而,在这种设置下我遇到了一些关键问题:
- 渲染速度非常慢。这是由于绘制的图形数量(和次数)引起的性能问题
- 底部时间范围控制无法调整。这是由于控件冻结引起的性能问题
- 我可以添加一个点,将图形向左动画化。但是,我无法在该新数据点中添加一个flag。请参见此SO问题。
B) 我查看了这些其他SO问题(Highstock性能问题,如何提高Highcharts性能? ),并尝试了他们的解决方案,但改进非常有限。
:turboThreshold 50 ;; tick-list length will be a max of 100
:shadow false
:marker {:enabled false}
:plotOptions{:series {:enableMouseTracking false}}
C) 我并没有看到这些Highstock问题的简单解决方案。 它是一个非常好的库。 但我正在查看Google Charts API,看看它是否能够满足这些要求。
- 在下面的所有交互中,Google Charts API的性能超过了Highstock ...
- 一个页面上有多个图表
- 一个视图中有多个重叠的图表
- 用于:线条、区域(范围)、直方图、阈值线(请参见上面的红色和绿色线条)的图表
- 轻松地向我的时间序列添加标记
- 轻松地向我的时间序列线图添加点
- 轻松地向我的时间序列线图同时添加点和标记
D) 有人经历过类似的事情吗? 有其他方法可以提高我的Highstock性能吗? Google Charts在这里能做得更好吗?
谢谢
附:我的highcharts调用代码如下(Clojurescript代码):
(defn chart-fill [selector dataList signal-map strategy-map label]

  (-> ($ selector)
      (.highcharts "StockChart" (clj->js
                                 {:names [label "Bolling Band" "Simple Moving Average" "Exponential Moving Average"]
                                  :rangeSelector {:selected 11}
                                  :title {:text label}
                                  :chart {:zoomType "x"}
                                  :navigator {:adaptToUpdatedData true}
                                  :yAxis [{
                                           :title {:text "Technical Analysis"}
                                           :height 200
                                           :shadow false
                                           :turboThreshold 50
                                           :marker {:enabled false}}
                                          {
                                           :title {:text "MACD / Signal"}
                                           :height 100
                                           :top 300
                                           :offset 0
                                           :lineWidth 2
                                           :turboThreshold 50
                                           :shadow false
                                           :marker {:enabled false}
                                           :plotOptions{:series {:enableMouseTracking false}}}
                                          {
                                           :title {:text "MACD Histog"}
                                           :height 100
                                           :top 400
                                           :offset 0
                                           :lineWidth 2
                                           :turboThreshold 50
                                           :shadow false
                                           :marker {:enabled false}
                                           :plotOptions{:series {:enableMouseTracking false}}}
                                          {
                                           :title {:text "Stochastic Osc"}
                                           :height 100
                                           :top 500
                                           :offset 0
                                           :lineWidth 2
                                           :max 1
                                           :min 0
                                           :turboThreshold 50
                                           :shadow false
                                           :marker {:enabled false}
                                           :plotOptions{:series {:enableMouseTracking false}}
                                           :plotLines [{
                                                        :value 0.75
                                                        :color "red"
                                                        :width 1
                                                        :dashStyle "longdash"
                                                        :label {:text "Overbought"}}
                                                       {
                                                        :value 0.25
                                                        :color "green"
                                                        :width 1
                                                        :dashStyle "longdash"
                                                        :label {:text "Oversold"}}]}
                                          {
                                           :title {:text "OBV"}
                                           :height 100
                                           :top 600
                                           :offset 0
                                           :lineWidth 2
                                           :turboThreshold 50
                                           :shadow false
                                           :marker {:enabled false}
                                           :plotOptions{:series {:enableMouseTracking false}}}]

                                  :series (build-graph-series-data dataList signal-map strategy-map)}))))