为matplotlib tricontourf设置掩码

6

我有一些包含数据的numpy数组,想要在一个二维网格上进行可视化。其中一些数据是不合理的,我想把它们屏蔽掉。但是,我无法正确地设置tricontour的mask属性。我尝试了:

import matplotlib.pyplot as mp
import numpy as np

with open('some_data.dat', 'r') as infile:
        x, y, z = np.loadtxt(infile, usecols=(0, 1, 2), unpack=True)
isbad = np.less(z, 1.4) | np.greater(z, 2.1)
mp.tricontourf(x, y, z, mask = isbad)

但是生成的图形并没有被遮盖。我尝试了在matplotlib中遮盖contourf图的一部分,即masking part of a contourf plot in matplotlib

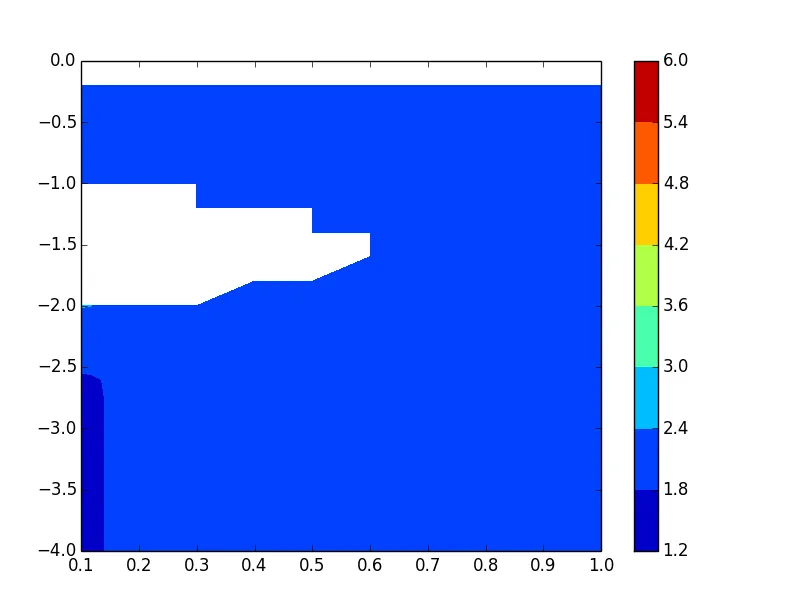
z2 = np.ma.array(z, mask= isbad)
mp.tricontourf(x, y, z2)

这也没有起作用。我想使用tricontourf代替contourf,因为我不想将数据网格化。

z[isbad] = np.nan

在调用tricontourf时会导致分段错误。

这是一个图例,红色的颜色是我想标记为非物理的。 A coloured contour plot with an overshooting color axis, due to unphysical data

2个回答

3
这里有个技巧。我需要收集三角形的索引(它们是对z!的索引),评估它们是否好,并且只接受至少一个角落有效的三角形(将维度从(ntri, 3)减少到ntri)。
import matplotlib.tri as tr
import numpy as np
import matplotlib.pyplot as plt

triang = tr.Triangulation(x, y)
mask = np.all(np.where(isbad[triang.triangles], True, False), axis=1)
triang.set_mask(mask)
colplt = plt.tricontourf(triang, z)
plt.colorbar()

受到此链接的启发:http://matplotlib.org/examples/pylab_examples/tripcolor_demo.html

Coloured contour plot with maksed unphysical region


1
如果一个节点具有NaN,则确实应该使用“any”而不是“all”,因为使用“all”仍将允许NaN值进入轮廓算法,并导致分段错误。 - Michael
我使用了 
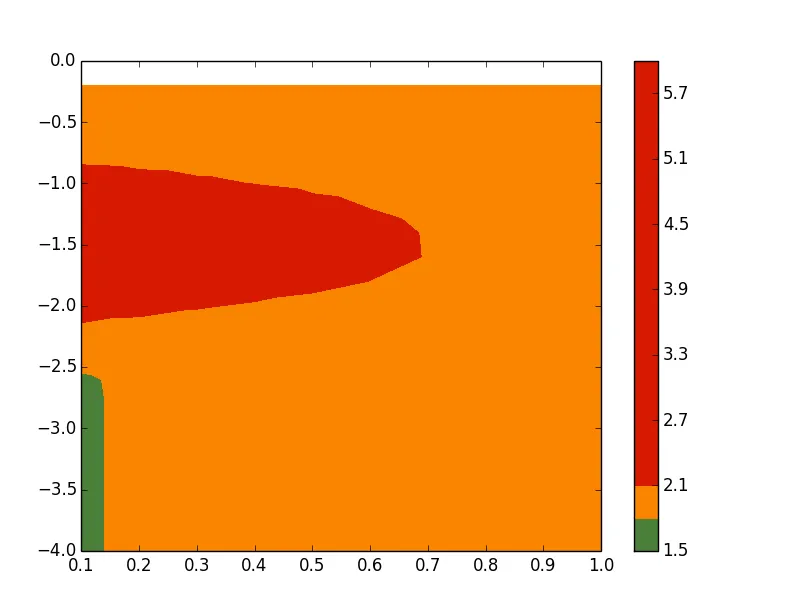
mask = np.sum(isbad[triang.triangles],axis=1)>1 来测试是否有2或3个节点是可疑的,因为我想要看到至少有一个节点在范围内的结果。 - Dave X

0

wsj的答案对我没用,因为它没有删除某些掩码点(我认为当不是所有节点都有问题时)。

这个解决方案做到了:

z[isbad] = numpy.NaN
z = numpy.ma.masked_invalid(z)
vmin, vmax = z.min(), z.max()
z = z.filled(fill_value=-999)

levels = numpy.linspace(vmin, vmax, n_points)
plt.tricontourf(x, y, z, levels=levels)

网页内容由stack overflow 提供, 点击上面的
可以查看英文原文,
原文链接