我想绘制实际时间序列值和预测值,但是出现了这个错误:
ValueError: 视图限制最小值-36816.95989583333小于1且为无效的Matplotlib日期值。如果将非日期时间值传递给具有日期时间单位的轴,则经常会发生这种情况。
我正在使用 statsmodels 将 arima 模型拟合到数据中。
这是我的数据样本:
datetime             value
2017-01-01 00:00:00  10.18
2017-01-01 00:15:00  10.2
2017-01-01 00:30:00  10.32
2017-01-01 00:45:00  10.16
2017-01-01 01:00:00  9.93
2017-01-01 01:15:00  9.77
2017-01-01 01:30:00  9.47
2017-01-01 01:45:00  9.08
这是我的代码:
mod = sm.tsa.statespace.SARIMAX(
subset,
order=(1, 1, 1),
seasonal_order=(1, 1, 1, 12),
enforce_stationarity=False,
enforce_invertibility=False
)
results = mod.fit()
pred_uc = results.get_forecast(steps=500)
pred_ci = pred_uc.conf_int(alpha = 0.05)
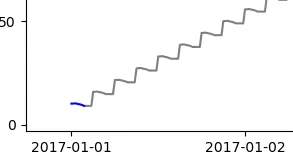
# Plot
fig = plt.figure(figsize=(12, 8))
ax = fig.add_subplot(1, 1, 1)
ax.plot(subset,color = "blue")
ax.plot(pred_uc.predicted_mean, color="black", alpha=0.5, label='SARIMAX')
plt.show()
有什么办法可以解决这个问题吗?
subset = subset.set_index("datetime")@Georgy - Joey12