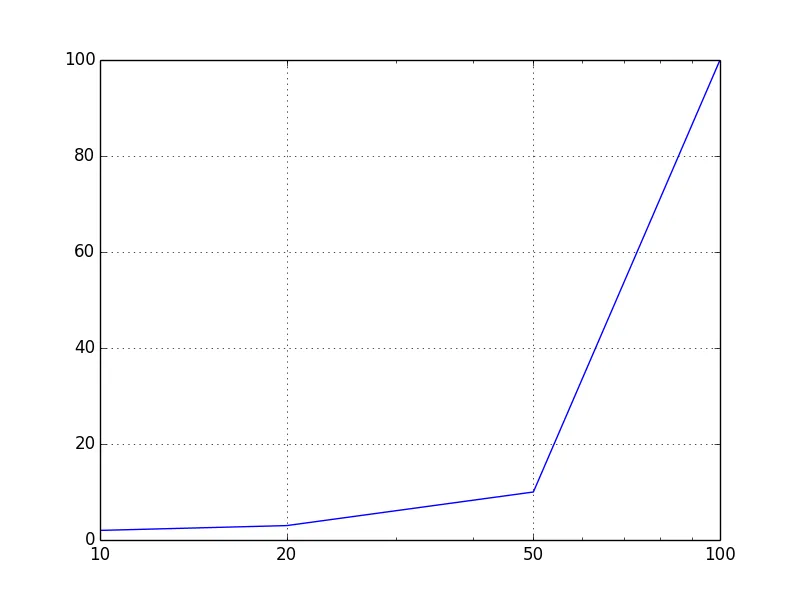
在对数刻度间隔下绘制x轴,但不用指数形式标记它。

3

我想使用pylab绘制两个数值 x = [0, 10,20,50,100]y=[1,2,3,10,100]。 我希望将 x 轴的间距保持在对数形式下。但是,我想在值为 10、20、50、100 处设置刻度,并将它们打印为非 10e1 或 10e2 的形式。 我按以下步骤进行操作:

 import matplotlib.pylab as plt
 plt.xscale('log')
 plt.plot(x, y)
 plt.xticks(x)
 plt.grid()

但是它保留了以10e1、10e2的形式表示的数值。

你能帮我吗?

2个回答

4
我认为您想要更改x轴的major_formatter
import matplotlib.pylab as plt
import numpy as np
from matplotlib.ticker import ScalarFormatter

x = [0, 10,20,50,100]
y=[1,2,3,10,100]

plt.plot(x, y)
plt.xscale('log')
plt.grid()

ax = plt.gca()
ax.set_xticks(x[1:]) # note that with a log axis, you can't have x = 0 so that value isn't plotted.
ax.xaxis.set_major_formatter(ScalarFormatter())

plt.show()

scalar_formatter


1
以下内容:
import matplotlib.pyplot as plt

x = [0,10,20,50,100]
y = [1,2,3,10,100]

f,ax = plt.subplots()
ax.plot(x,y)
ax.set_xscale('log')
ax.set_xticks(x)
ax.set_xticklabels(x)
ax.set_xlim([0,100])

将产生

enter image description here


网页内容由stack overflow 提供, 点击上面的
可以查看英文原文,
原文链接