输入的值数组 [0,1,10] 并不是一个真正的图像数组。图像数组应该从 0 到 255 或者从 0. 到 1.。
a. 使用 LinearSegmentedColormap
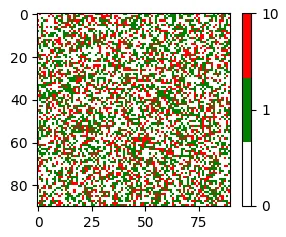
一种想法是将你的数组 im 归一化为 1.: im = im/im.max()。然后可以使用 matplotlib.colors.LinearSegmentedColormap.from_list 创建值为 0 -> 白色, 0.1 -> 绿色, 1 -> 红色 的 colormap。
import matplotlib.image
import numpy as np
im = np.random.choice([0,1,10], size=(90, 90), p=[0.5,0.3,0.2])
im2 = im/10.
clist = [(0,"white"), (1./10.,"green"), (1, "red")]
cmap = matplotlib.colors.LinearSegmentedColormap.from_list("name", clist)
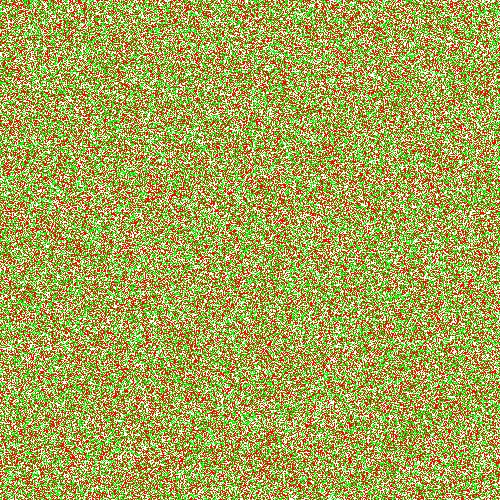
matplotlib.image.imsave(__file__+'.png', im, cmap=cmap)

对应的pyplot图表
import matplotlib.pyplot as plt
plt.imshow(im, cmap=cmap)
plt.colorbar(ticks=[0,1,10])
plt.show()
这将会是这个样子
b. 使用ListedColormap
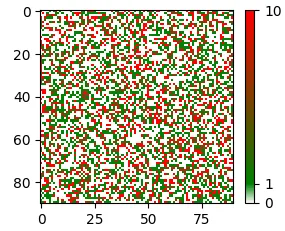
可以使用ListedColormap生成一个包含三种颜色(白色、绿色和红色)的颜色地图。在此颜色地图中,颜色间距相等,因此需要将图像数组映射到等间距值上。可以使用np.unique(im,return_inverse=True)[1].reshape(im.shape)来完成,该函数返回一个仅包含值为[0, 1, 2]的数组。同样需要进行归一化处理。
im = np.random.choice([0,1,10], size=(90, 90), p=[0.5,0.3,0.2])

im2 = np.unique(im,return_inverse=True)[1].reshape(im.shape)
im3 = im2/float(im2.max())

clist = ["white", "green","red"]
cmap = matplotlib.colors.ListedColormap(clist)
matplotlib.image.imsave(__file__+'2.png',im3, cmap=cmap)

虽然输出的图像与上面完全相同,但对应的matplotlib图将具有不同的色条。
import matplotlib.pyplot as plt
plt.imshow(im2, cmap=cmap)
cb = plt.colorbar(ticks=[0,1,2])
cb.ax.set_yticklabels([0,1,10])
plt.show()