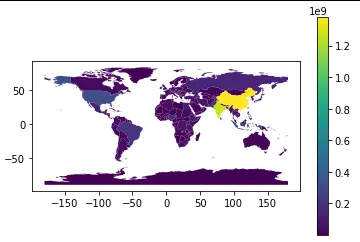
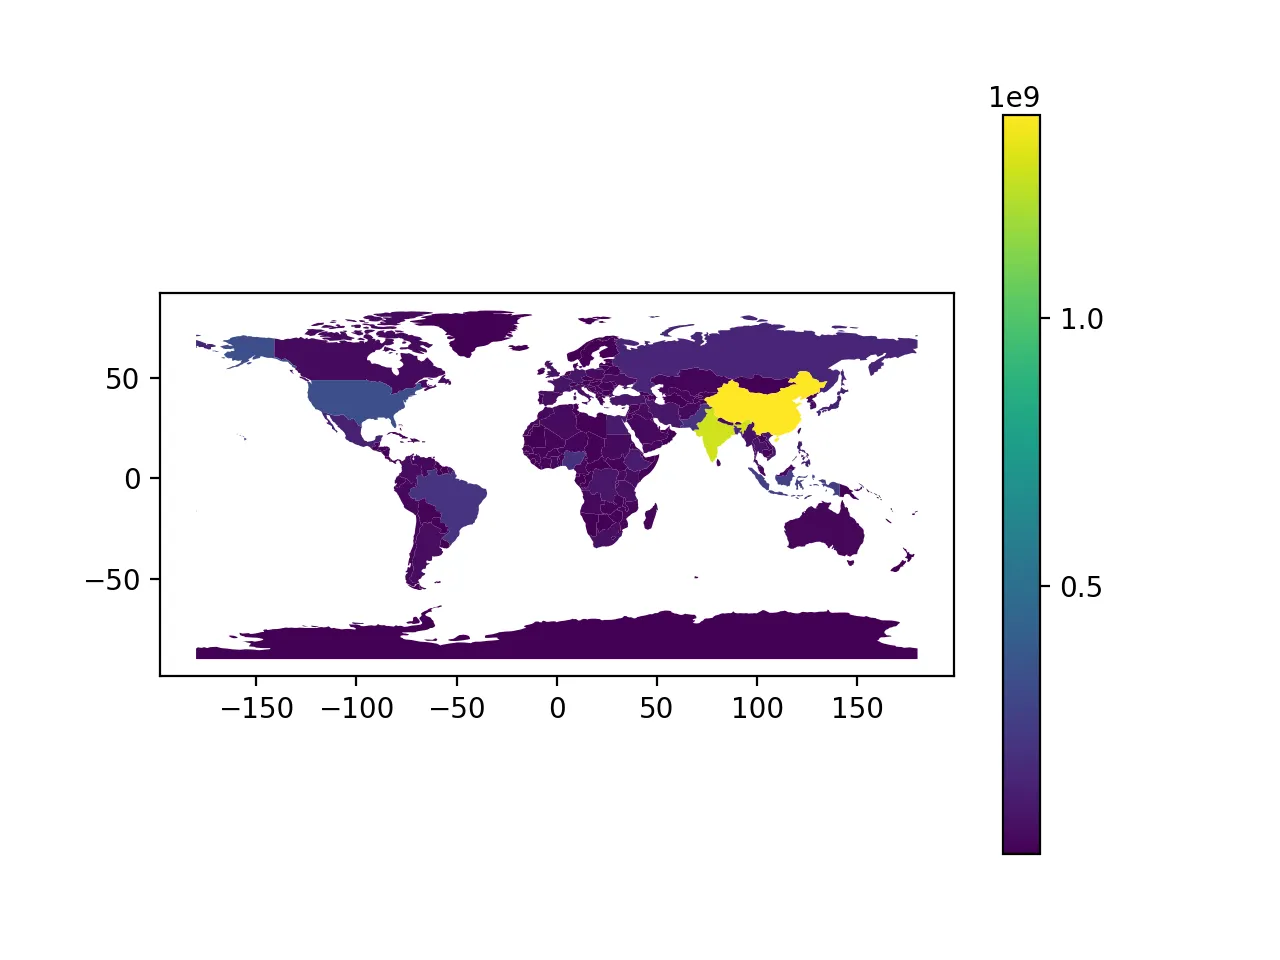
自定义色图的刻度标记

3

如何确定我想在颜色地图上显示哪些数字?

例如,GeoPandas自动显示0.2*10^90.4*10^90.6*10^9等等。如果我只想在正确的位置显示0500,000,0001,000,000,000怎么办?

import geopandas as gpd

world = gpd.read_file(gpd.datasets.get_path('naturalearth_lowres'))
world.plot(column='pop_est', legend=True)

enter image description here

1个回答

3
您可以使用参数 legend_kwds,并将所需的刻度传递为列表。
import matplotlib.pyplot as plt
import geopandas as gpd

world = gpd.read_file(gpd.datasets.get_path('naturalearth_lowres'))
world.plot(
    column='pop_est', 
    legend=True,
    legend_kwds={'ticks': [0,500000000,1000000000]}
)
plt.show()

enter image description here


网页内容由stack overflow 提供, 点击上面的
可以查看英文原文,
原文链接