在matplotlib中绘制的两条线图的交点如何寻找

3

有没有办法在matplotlib中找到两条线图的交点?

考虑以下代码:

import numpy as np
import matplotlib.pyplot as plt


fig = plt.figure()


ax = fig.add_subplot(111)

ax.plot([1,2,3,4,5,6,7,8],[20,100,50,120,55,240,50,25],color='lightblue',linewidth=3)
ax.plot([3,4,5,6,7,8,9], [25,35,14,67,88,44,120], color='darkgreen', marker='^')

我尝试参考Python - matplotlib: find intersection of lineplots,但该方法似乎太复杂了 - 它涉及到像分段多项式插值这样的高级数学概念,虽然可以从文档中理解 API 的用途,但并不真正了解 Piecewise polynomial 解决方案背后的概念。如果有人能够提供更简单的解决方案或解释分段多项式解决方案的原理,那会很有帮助。


你是否在寻找这个...https://dev59.com/tV4b5IYBdhLWcg3wtjvY - Eular
2个回答

4

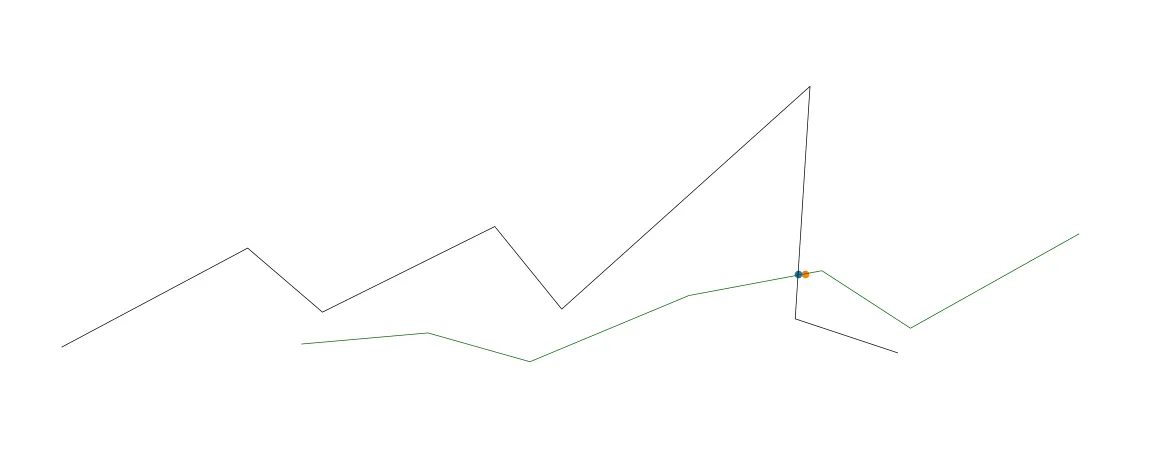
这里有一个丑陋的解决方案(改进版本在底部)。绘制图表后,我们知道两条线图在(6, 7)范围内交叉。
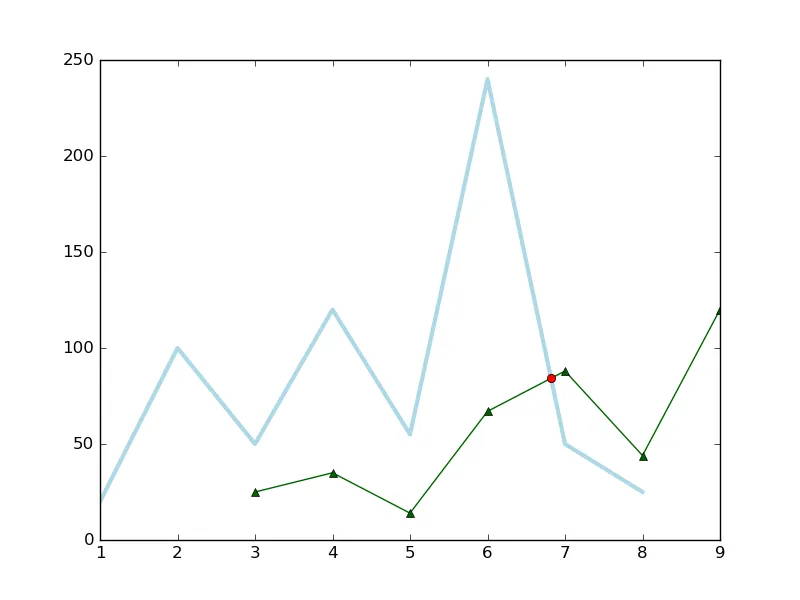
enter image description here

现在,我们使用以下源代码绘制此交点:
import numpy as np
import matplotlib.pyplot as plt

fig = plt.figure()
ax = fig.add_subplot(111)

x1 = [1,2,3,4,5,6,7,8]
y1 = [20,100,50,120,55,240,50,25]
x2 = [3,4,5,6,7,8,9]
y2 = [25,35,14,67,88,44,120]

ax.plot(x1, y1, color='lightblue',linewidth=3)
ax.plot(x2, y2, color='darkgreen', marker='^')


# Plot the cross point

x3 = np.linspace(6, 7, 1000)        # (6, 7) intersection range
y1_new = np.linspace(240, 50, 1000) # (6, 7) corresponding to (240, 50) in y1
y2_new = np.linspace(67, 88, 1000)  # (6, 7) corresponding to (67, 88) in y2

idx = np.argwhere(np.isclose(y1_new, y2_new, atol=0.1)).reshape(-1)
ax.plot(x3[idx], y2_new[idx], 'ro')

plt.show()

最终用户不希望手动输入横向范围。以下是改进版本,通过循环每两个段落来实现,但可能需要耗费时间。
import numpy as np
import matplotlib.pyplot as plt

fig = plt.figure()
ax = fig.add_subplot(111)

x1 = [1,2,3,4,5,6,7,8]
y1 = [20,100,50,120,55,240,50,25]
x2 = [3,4,5,6,7,8,9]
y2 = [25,35,14,67,88,44,120]

ax.plot(x1, y1, color='lightblue',linewidth=3)
ax.plot(x2, y2, color='darkgreen', marker='^')

# Get the common range, from `max(x1[0], x2[0])` to `min(x1[-1], x2[-1])`   
x_begin = max(x1[0], x2[0])     # 3
x_end = min(x1[-1], x2[-1])     # 8

points1 = [t for t in zip(x1, y1) if x_begin<=t[0]<=x_end]  # [(3, 50), (4, 120), (5, 55), (6, 240), (7, 50), (8, 25)]
points2 = [t for t in zip(x2, y2) if x_begin<=t[0]<=x_end]  # [(3, 25), (4, 35), (5, 14), (6, 67), (7, 88), (8, 44)]

idx = 0
nrof_points = len(points1)
while idx < nrof_points-1:
    # Iterate over two line segments
    y_min = min(points1[idx][1], points1[idx+1][1]) 
    y_max = max(points1[idx+1][1], points2[idx+1][1]) 

    x3 = np.linspace(points1[idx][0], points1[idx+1][0], 1000)      # e.g., (6, 7) intersection range
    y1_new = np.linspace(points1[idx][1], points1[idx+1][1], 1000)  # e.g., (6, 7) corresponding to (240, 50) in y1
    y2_new = np.linspace(points2[idx][1], points2[idx+1][1], 1000)  # e.g., (6, 7) corresponding to (67, 88) in y2

    tmp_idx = np.argwhere(np.isclose(y1_new, y2_new, atol=0.1)).reshape(-1)
    if tmp_idx:
        ax.plot(x3[tmp_idx], y2_new[tmp_idx], 'ro')                 # Plot the cross point

    idx += 1

plt.show()

我正在实际场景中对图表进行动画处理,我认为最终用户不会喜欢提供输入(6,7)来获取答案-谢谢。 - basum
@basum,我同意。这就是为什么我说这是个丑陋的解决方案。 - SparkAndShine
@basum,我已经在我的答案中添加了一个改进版,不需要手动输入交叉范围。 - SparkAndShine

1
我将@SparkAndShine的解决方案扩展为适用于3D数据,并使用KD树进行了一些性能优化。完整的解决方案发布在这里:https://dev59.com/tV4b5IYBdhLWcg3wtjvY#51145981

enter image description here

import numpy as np
import matplotlib.pyplot as plt
from mpl_toolkits.mplot3d import Axes3D
from scipy.spatial import cKDTree
from scipy import interpolate

fig = plt.figure()
ax = fig.add_axes([0, 0, 1, 1], projection='3d')
ax.axis('off')

def upsample_coords(coord_list):
    # s is smoothness, set to zero
    # k is degree of the spline. setting to 1 for linear spline
    tck, u = interpolate.splprep(coord_list, k=1, s=0.0)
    upsampled_coords = interpolate.splev(np.linspace(0, 1, 100), tck)
    return upsampled_coords

# target line
x_targ = [1, 2, 3, 4, 5, 6, 7, 8]
y_targ = [20, 100, 50, 120, 55, 240, 50, 25]
z_targ = [20, 100, 50, 120, 55, 240, 50, 25]
targ_upsampled = upsample_coords([x_targ, y_targ, z_targ])
targ_coords = np.column_stack(targ_upsampled)

# KD-tree for nearest neighbor search
targ_kdtree = cKDTree(targ_coords)

# line two
x2 = [3,4,5,6,7,8,9]
y2 = [25,35,14,67,88,44,120]
z2 = [25,35,14,67,88,44,120]
l2_upsampled = upsample_coords([x2, y2, z2])
l2_coords = np.column_stack(l2_upsampled)

# plot both lines
ax.plot(x_targ, y_targ, z_targ, color='black', linewidth=0.5)
ax.plot(x2, y2, z2, color='darkgreen', linewidth=0.5)

# find intersections
for i in range(len(l2_coords)):
    if i == 0:  # skip first, there is no previous point
        continue

    distance, close_index = targ_kdtree.query(l2_coords[i], distance_upper_bound=.5)

    # strangely, points infinitely far away are somehow within the upper bound
    if np.isinf(distance):
        continue

    # plot ground truth that was activated
    _x, _y, _z = targ_kdtree.data[close_index]
    ax.scatter(_x, _y, _z, 'gx')
    _x2, _y2, _z2 = l2_coords[i]
    ax.scatter(_x2, _y2, _z2, 'rx')  # Plot the cross point


plt.show()

网页内容由stack overflow 提供, 点击上面的
可以查看英文原文,
原文链接