我正在从GIS数据库读取数据,并使用mpl_toolkits.basemap和matplotlib创建地图。一些数据创建了复杂的多边形(由外部和内部环定义)。然而,我还没有找到如何创建带孔洞的多边形。在matplotlib中是否可能实现?还有其他方法可以创建此图像吗?
4个回答
14
在matplotlib中,实际上可以绘制具有孔洞的多边形。诀窍是使用Path和PathPatch。例如:
import matplotlib.pyplot as plt
from matplotlib.patches import PathPatch
from matplotlib.path import Path

axes = plt.gca()

path = Path([(2,2)      ,(2,-2)     ,(-2,-2)    ,(-2,2)     ,(0,0)         ,(1,0)      ,(-1,1)     ,(-1,-1)    ,(0,0)         ],
            [Path.MOVETO,Path.LINETO,Path.LINETO,Path.LINETO,Path.CLOSEPOLY,Path.MOVETO,Path.LINETO,Path.LINETO,Path.CLOSEPOLY])
patch = PathPatch(path)
axes.set_xlim(-3,3)
axes.set_ylim(-3,3)
axes.add_patch(patch)

plt.savefig('example.png')
plt.close('all')
以上结果导致
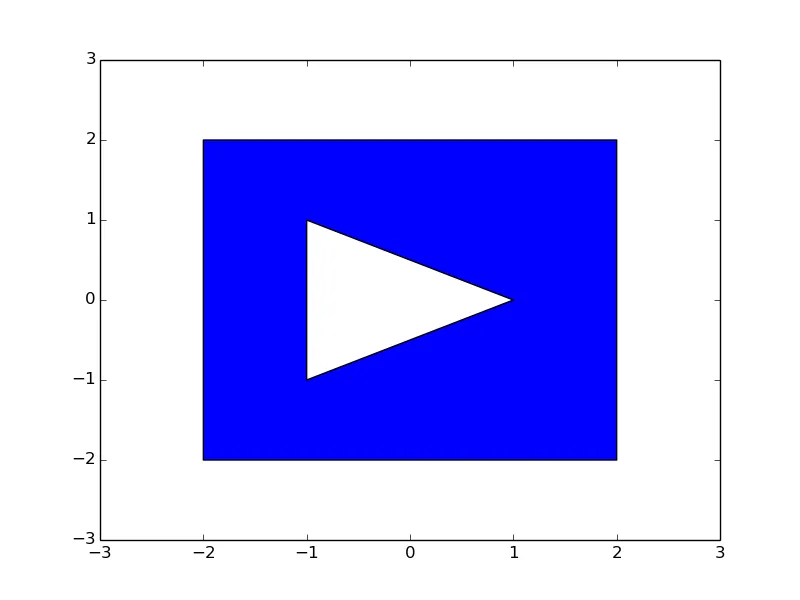 请注意,卷绕顺序似乎很重要。
- Jasper
1
太好了!谢谢您的发布,这非常简单。 - Jason S
2
虽然有些晚了,但我使用这种方法修改了@Matt的答案,并编写了以下代码(也在此处):
import numpy as np
from matplotlib.path import Path
from matplotlib.patches import PathPatch


def patchify(polys):
    """Returns a matplotlib patch representing the polygon with holes.

    polys is an iterable (i.e list) of polygons, each polygon is a numpy array
    of shape (2, N), where N is the number of points in each polygon. The first
    polygon is assumed to be the exterior polygon and the rest are holes. The
    first and last points of each polygon may or may not be the same.

    This is inspired by
    https://sgillies.net/2010/04/06/painting-punctured-polygons-with-matplotlib.html

    Example usage:
    ext = np.array([[-4, 4, 4, -4, -4], [-4, -4, 4, 4, -4]])
    t = -np.linspace(0, 2 * np.pi)
    hole1 = np.array([2 + 0.4 * np.cos(t), 2 + np.sin(t)])
    hole2 = np.array([np.cos(t) * (1 + 0.2 * np.cos(4 * t + 1)),
                      np.sin(t) * (1 + 0.2 * np.cos(4 * t))])
    hole2 = np.array([-2 + np.cos(t) * (1 + 0.2 * np.cos(4 * t)),
                      1 + np.sin(t) * (1 + 0.2 * np.cos(4 * t))])
    hole3 = np.array([np.cos(t) * (1 + 0.5 * np.cos(4 * t)),
                      -2 + np.sin(t)])
    holes = [ext, hole1, hole2, hole3]
    patch = patchify([ext, hole1, hole2, hole3])
    ax = plt.gca()
    ax.add_patch(patch)
    ax.set_xlim([-6, 6])
    ax.set_ylim([-6, 6])
    """

    def reorder(poly, cw=True):
        """Reorders the polygon to run clockwise or counter-clockwise
        according to the value of cw. It calculates whether a polygon is
        cw or ccw by summing (x2-x1)*(y2+y1) for all edges of the polygon,
        see https://dev59.com/r3M_5IYBdhLWcg3w6X5e#1165943.
        """
        # Close polygon if not closed
        if not np.allclose(poly[:, 0], poly[:, -1]):
            poly = np.c_[poly, poly[:, 0]]
        direction = ((poly[0] - np.roll(poly[0], 1)) *
                     (poly[1] + np.roll(poly[1], 1))).sum() < 0
        if direction == cw:
            return poly
        else:
            return poly[::-1]

    def ring_coding(n):
        """Returns a list of len(n) of this format:
        [MOVETO, LINETO, LINETO, ..., LINETO, LINETO CLOSEPOLY]
        """
        codes = [Path.LINETO] * n
        codes[0] = Path.MOVETO
        codes[-1] = Path.CLOSEPOLY
        return codes

    ccw = [True] + ([False] * (len(polys) - 1))
    polys = [reorder(poly, c) for poly, c in zip(polys, ccw)]
    codes = np.concatenate([ring_coding(p.shape[1]) for p in polys])
    vertices = np.concatenate(polys, axis=1)
    return PathPatch(Path(vertices.T, codes))
- yohai
1
虽然是老问题,但是...
只需明确关闭外部和内部边界并将它们相加即可。从技术上讲,会有一个接缝,但你看不到它(如果提供颜色参数的话——不太确定为什么会这样)。
#!/usr/bin/env python3

import matplotlib.pyplot as plt

# a 4x4 box (counterclockwise)
ext_x = [2, -2, -2, 2, 2]
ext_y = [2, 2, -2, -2, 2]

# a 2x2 hole in the box (clockwise)
int_x = [item/2.0 for item in ext_x][::-1]
int_y = [item/2.0 for item in ext_y][::-1]

# if you don't specify a color, you will see a seam
plt.fill(ext_x+int_x, ext_y+int_y, color='blue')

plt.show()
- Shay
2
太好了!但是如果您将alpha设置为小于1,则接缝仍然可见,除非您还指定lw=0。 - fra_pero
如果我将alpha设置为小于1,但我只想要外部边缘怎么办?也许我应该发一个新问题。 - fra_pero
-1
fill_between() 怎么样?
http://matplotlib.sourceforge.net/api/pyplot_api.html#matplotlib.pyplot.fill_between
我不确定如何精确地绘制一个多边形,但它的工作原理是这样的
import numpy as np
import matplotlib.pylab as plt

x=np.arange(-3,3.5,.5)
y1=-x**2+9
y2=-x**2+10
plt.fill_between(x,y1,y2)
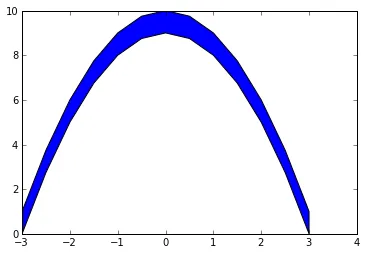
你可以一次一个填充区域地构建你的图形,直到达到你想要的效果。
或者可能是 path。看看这些 screenshots,看是否有任何接近的东西。
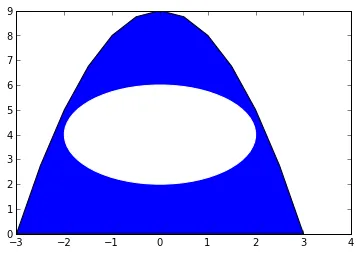
编辑:也许你指的是这样一个洞
import numpy as np
import matplotlib.pylab as plt

x=np.arange(-3,3.5,.5)
y1=-x**2+9
y2=0
plt.fill_between(x,y1,y2)
circ=plt.Circle((0,4),2,color='w')
ax=plt.gca()
ax.add_patch(circ)
plt.show()
- Matt
2
1这肯定会创建一个多边形,但不是带有洞的。 - Mark Ransom
我不认为我理解"上面有个洞"。我以为你是指空心的。洞的大小,就我所想象的而言,将取决于你将y2放在y1的何处。 - Matt
网页内容由stack overflow 提供, 点击上面的可以查看英文原文,
原文链接
原文链接