我有以下格式的x、y坐标输入值:
[[1,1], [2,1], [2,2], [1,2], [0.5,1.5]]
我想画多边形,但是不知道如何画!
谢谢
我有以下格式的x、y坐标输入值:
[[1,1], [2,1], [2,2], [1,2], [0.5,1.5]]
我想画多边形,但是不知道如何画!
谢谢
使用 matplotlib.pyplot
import matplotlib.pyplot as plt

coord = [[1,1], [2,1], [2,2], [1,2], [0.5,1.5]]
coord.append(coord[0]) #repeat the first point to create a 'closed loop'

xs, ys = zip(*coord) #create lists of x and y values

plt.figure()
plt.plot(xs,ys)
plt.show() # if you need...
plt.show(),所以我没有考虑它... - Julienmatplotlib.patches添加会更容易/更快,如此处所述:[https://dev59.com/3FoU5IYBdhLWcg3wc2xW] - Addison Klinkeimport numpy as np
import matplotlib.pyplot as plt
from matplotlib.patches import Polygon
y = np.array([[1,1], [2,1], [2,2], [1,2], [0.5,1.5]])
p = Polygon(y, facecolor = 'k')
fig,ax = plt.subplots()
ax.add_patch(p)
ax.set_xlim([0,3])
ax.set_ylim([0,3])
plt.show()
numpy不是必需的。Polygon()将接受类似以下形式的多边形:[(0, 0), (10, 0), (10, 10), (0, 10)]。 - undefined另一种绘制多边形的方法是这样的:
import PIL.ImageDraw as ImageDraw
import PIL.Image as Image

image = Image.new("RGB", (640, 480))

draw = ImageDraw.Draw(image)

# points = ((1,1), (2,1), (2,2), (1,2), (0.5,1.5))
points = ((100, 100), (200, 100), (200, 200), (100, 200), (50, 150))
draw.polygon((points), fill=200)

image.show()
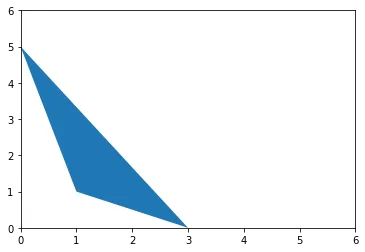
matplotlib.patches有一个名为Polygon的函数,可以通过from matplotlib.patches import Polygon进行导入。您可以使用轴对象的add_patch方法来绘制多边形。
from matplotlib.patches import Polygon
import matplotlib.pyplot as plt

polygon1 = Polygon([(0,5), (1,1), (3,0),])

fig, ax = plt.subplots(1,1)

ax.add_patch(polygon1)

plt.ylim(0,6)
plt.xlim(0,6)
dots = [[1,1], [2,1], [2,2], [1,2], [0.5,1.5]]
from tkinter import Canvas
c = Canvas(width=750, height=750)
c.pack()
out = []
for x,y in dots:
    out += [x*250, y*250]
c.create_polygon(*out, fill='#aaffff')#fill with any color html or name you want, like fill='blue'
c.update()
dots = [[1,1], [2,1], [2,2], [1,2], [0.5,1.5]]
out = []
for x,y in dots:
    out.append([x*250, y*250])
import pygame, sys
from pygame.locals import *
pygame.init()
DISPLAYSURF = pygame.display.set_mode((750, 750), 0, 32)
pygame.display.set_caption('WindowName')
DISPLAYSURF.fill((255,255,255))#< ; \/ - colours
pygame.draw.polygon(DISPLAYSURF, (0, 255,0), out)
while True:
    for event in pygame.event.get():
        if event.type == QUIT:
            pygame.quit()
            sys.exit()
    pygame.display.update()
tkinter,其次需要使用 pygame。前者加载速度更快,后者绘制速度更快,如果您将DISPLAYSURF.fill和稍微不同坐标的pygame.draw.polygon放入循环中,它会比在 tkinter 中执行相同操作更好。因此,如果您的多边形正在飞行和弹跳,请使用第二个,但如果它只是静态的东西,请使用第一个。另外,在 Python2 中使用from Tkinter,而不是from tkinter。matplotlib使用tkinter,可能更容易使用,但实际上它是更酷的tkinter窗口。PIL使用了非常好的图像编辑工具imagemagick。PIL。 matplotlib.pyplot 。pygame。tkinter。
tkinter的初始化速度很快。pygame更新速度很快。pyplot只是一个几何工具。其他的回答似乎都很高级,我猜这是因为我是一名机械工程师的印象。以下是这段代码的一个简单版本:
from numpy import *
from matplotlib.pyplot import *
x = ([1,2,2,1,0.5,1])
y = ([1,1,2,2,1.5,1])
plot(x,y)
show()
plot 属于 numpy 还是 matplotlib.pyplot。同样的情况也适用于 show。 - Safwan Samsudeenskimage.draw.polygon2mask(image_shape, polygon) 直接返回一个布尔类型的numpy数组,其中True表示该点在多边形内。skimage.draw.polygon(r, c[, shape]) 返回矩阵点的行列索引,这些点在多边形内部。此函数由polygon2mask()在内部调用。skimage.draw.polygon_perimeter(r, c[, shape[, clip]]) 返回最好表示多边形周长的点的行列索引。这可能包括polygon()会忽略的点。如果您的基准测试结果不同,请纠正我,但我认为这些函数相当快。
import numpy as np
from skimage.draw import polygon2mask, polygon, polygon_perimeter

shape = (10, 10)  # image shape
points = [(5, -1), (-1, 5), (5, 11), (10, 5)]  # polygon points

imgp2 = polygon2mask(shape, points).astype(str)  # astype() converts bools to strings
imgp2[imgp2 == "True"] = "O"
imgp2[imgp2 == "False"] = "."

imgp = np.full(shape, ".")  # fill a n*d matrix with '.'
imgpp = imgp.copy()
points = np.transpose(points)  # change format to ([5, -1, 5, 10], [-1, 5, 11, 5])

rr, cc = polygon(*points, shape=shape)
imgp[rr, cc] = "O"

rr, cc = polygon_perimeter(*points, shape=shape, clip=True)
imgpp[rr, cc] = "O"

print(imgp2, imgp, imgpp, sep="\n\n")
结果:
[['.' '.' '.' '.' 'O' 'O' '.' '.' '.' '.']
 ['.' '.' '.' 'O' 'O' 'O' 'O' '.' '.' '.']
 ['.' '.' 'O' 'O' 'O' 'O' 'O' 'O' '.' '.']
 ['.' 'O' 'O' 'O' 'O' 'O' 'O' 'O' 'O' '.']
 ['O' 'O' 'O' 'O' 'O' 'O' 'O' 'O' 'O' 'O']
 ['O' 'O' 'O' 'O' 'O' 'O' 'O' 'O' 'O' 'O']
 ['.' 'O' 'O' 'O' 'O' 'O' 'O' 'O' 'O' 'O']
 ['.' '.' 'O' 'O' 'O' 'O' 'O' 'O' 'O' '.']
 ['.' '.' '.' 'O' 'O' 'O' 'O' 'O' '.' '.']
 ['.' '.' '.' '.' 'O' 'O' 'O' '.' '.' '.']]

[['.' '.' '.' '.' 'O' 'O' 'O' '.' '.' '.']
 ['.' '.' '.' 'O' '.' '.' '.' 'O' '.' '.']
 ['.' '.' 'O' '.' '.' '.' '.' '.' 'O' '.']
 ['.' 'O' '.' '.' '.' '.' '.' '.' '.' 'O']
 ['O' '.' '.' '.' '.' '.' '.' '.' '.' 'O']
 ['O' '.' '.' '.' '.' '.' '.' '.' '.' 'O']
 ['O' '.' '.' '.' '.' '.' '.' '.' '.' 'O']
 ['.' 'O' 'O' '.' '.' '.' '.' '.' '.' 'O']
 ['.' '.' '.' 'O' '.' '.' '.' 'O' 'O' '.']
 ['.' '.' '.' '.' 'O' 'O' 'O' '.' '.' '.']]
这是一个一行代码的示例(假设你已经导入了matplotlib.pyplot并定义了你的多边形 - 如果没有,则需要三行^^):
import matplotlib.pyplot as plt
poly = [[1,1], [2,1], [2,2], [1,2], [0.5,1.5]]

plt.plot(*np.column_stack(poly+[poly[0]]));
tkinter画布非常强大,可以轻松绘制各种多边形,并且具有许多内置属性,可以进行操作:
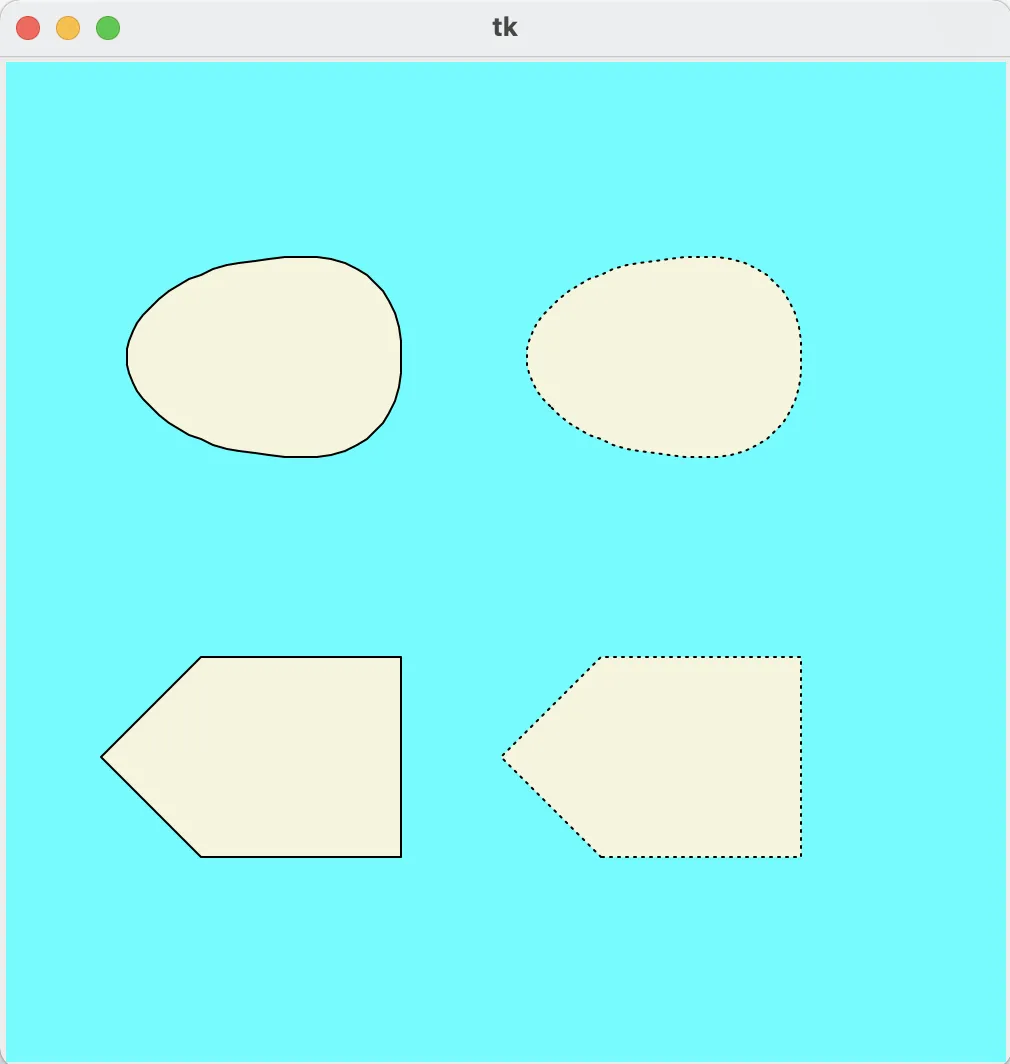
import tkinter as tk


def _scale_and_flip(point, offset):
    """
    scales the provided point and flips the y axis so it points upwards
    origin (0, 0) at the bottom left corner of the screen
    returns the point scaled and flipped
    """
    x, y = point
    ox, oy = offset
    return ((x+ox) * SCALE, HEIGHT - (y+oy) * SCALE)

def scale_and_flip(polygon, offset=(0, 0)):
    """
    scales the provided point and flips the y axis so it points upwards
    origin (0, 0) at the bottom left corner of the screen
    returns a sequence of scaled and flipped points representing the polygon ready to render
    """
    return [_scale_and_flip(point, offset) for point in polygon]


if __name__ == '__main__':
    WIDTH, HEIGHT = 500, 500
    SCALE = 100
    polygon_points = [[1, 1], [2, 1], [2, 2], [1, 2], [0.5, 1.5]]

    root = tk.Tk()
    canvas = tk.Canvas(root, width=WIDTH, height=HEIGHT, bg='cyan')
    canvas.pack()

    canvas.create_polygon(scale_and_flip(polygon_points), fill='beige', outline='black')
    canvas.create_polygon(scale_and_flip(polygon_points, (0, 2)), fill='beige', outline='black', smooth=True)
    canvas.create_polygon(scale_and_flip(polygon_points, (2, 0)), fill='beige', outline='black', dash=(1, 3))
    canvas.create_polygon(scale_and_flip(polygon_points, (2, 2)), fill='beige', outline='black', dash=(1, 3), smooth=True)

    root.mainloop()
您可以在这里找到更多关于tk.Canvas.create_polygon的选项和属性。
虽然已经有很多答案,但是我使用海龟模块的方法如下。海龟模块提供了面向对象和面向过程的海龟图形原语。
import turtle


t = turtle.Turtle()

# input for number of sides
n_sides = int(input("Enter the sides of the polygon : "))

# length of the polygon
l_sides = int(input("Enter the length of the polygon : "))


for _ in range(n_sides):
    turtle.fd(l_sides)
    turtle.rt(360 / n_sides)