我正在尝试从数据框中按组/分面绘制相关图。如果我为每个变量子集数据,我可以做到这一点。如何同时为所有变量执行此操作,以基于每个变量生成分面图?
###Load libraries
library(gdata)
library(corrplot)
library(ggplot2)
library(gtable)
library(ggpmisc)
library(grid)
library(reshape2)
library(plotly)
packageVersion('plotly')

##Subset ample data from the "iris" data set in R
B<-iris[iris$Species == "virginica", ]

##calculate correlation for numeric columns only
M<-cor(B[,1:4])
head(round(M,2))

###calculate significance
cor.mtest <- function(mat, ...) {
mat <- as.matrix(mat)
n <- ncol(mat)
p.mat<- matrix(NA, n, n)
diag(p.mat) <- 0
for (i in 1:(n - 1)) {
    for (j in (i + 1):n) {
        tmp <- cor.test(mat[, i], mat[, j], ...)
        p.mat[i, j] <- p.mat[j, i] <- tmp$p.value
    }
}
colnames(p.mat) <- rownames(p.mat) <- colnames(mat)
p.mat
}
# matrix of the p-value of the correlation
p.mat <- cor.mtest(B[,1:4])

###plot
#color ramp
col<- colorRampPalette(c("red","white","blue"))(40)
corrplot(M, type="upper",tl.col="black", tl.cex=0.7,tl.srt=45, col=col,
p.mat = p.mat, insig = "blank", sig.level = 0.01)
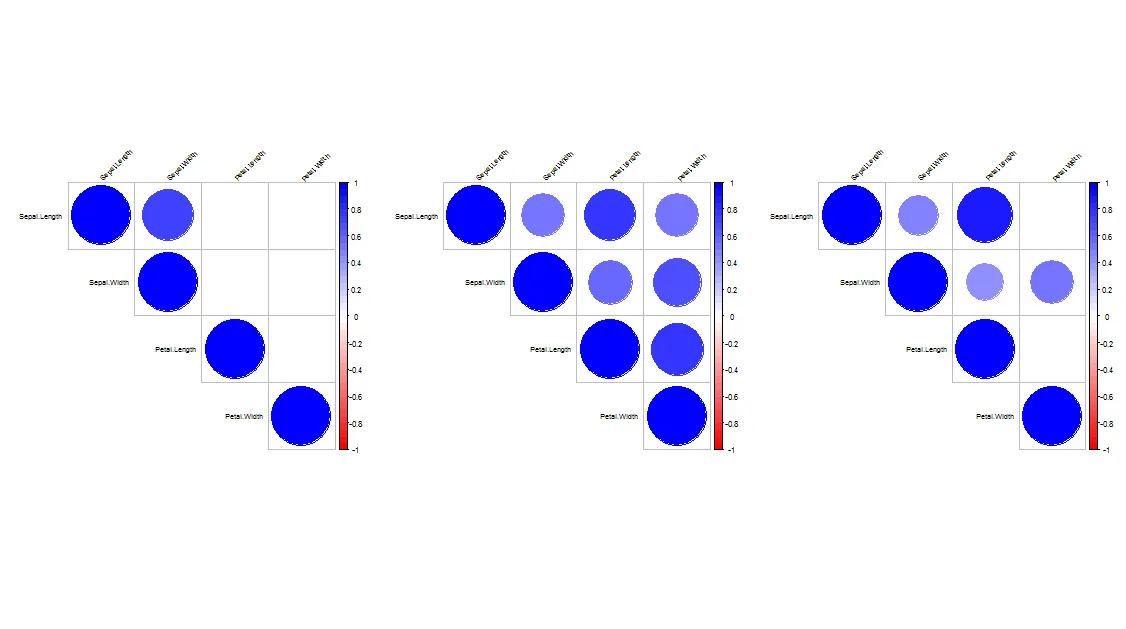
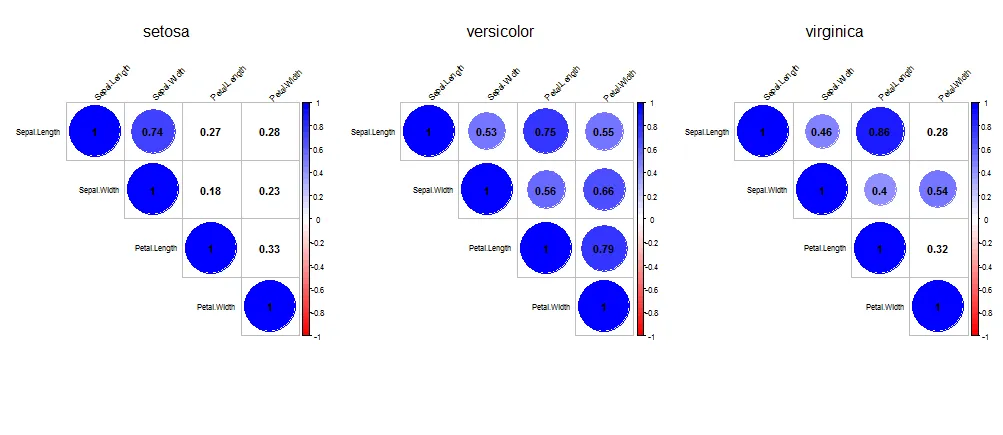
这很好,因为我从数据框中只拿出了一个变量“virginica”。如何自动化这个过程,对于所有单独的变量进行唯一的相关计算,然后绘制corrplot作为单独的面板?