如何在Plotly Python中将箱线图的中位数与多类别X轴连接

4

我正在尝试绘制这个图表,但在stackoverflow或者plotly论坛中找不到任何示例。我在此处放置了plotly js示例以更好地重现代码。但是我真正需要的解决方案是使用plotly python

非常感谢您提供此问题的指南或解决方案。

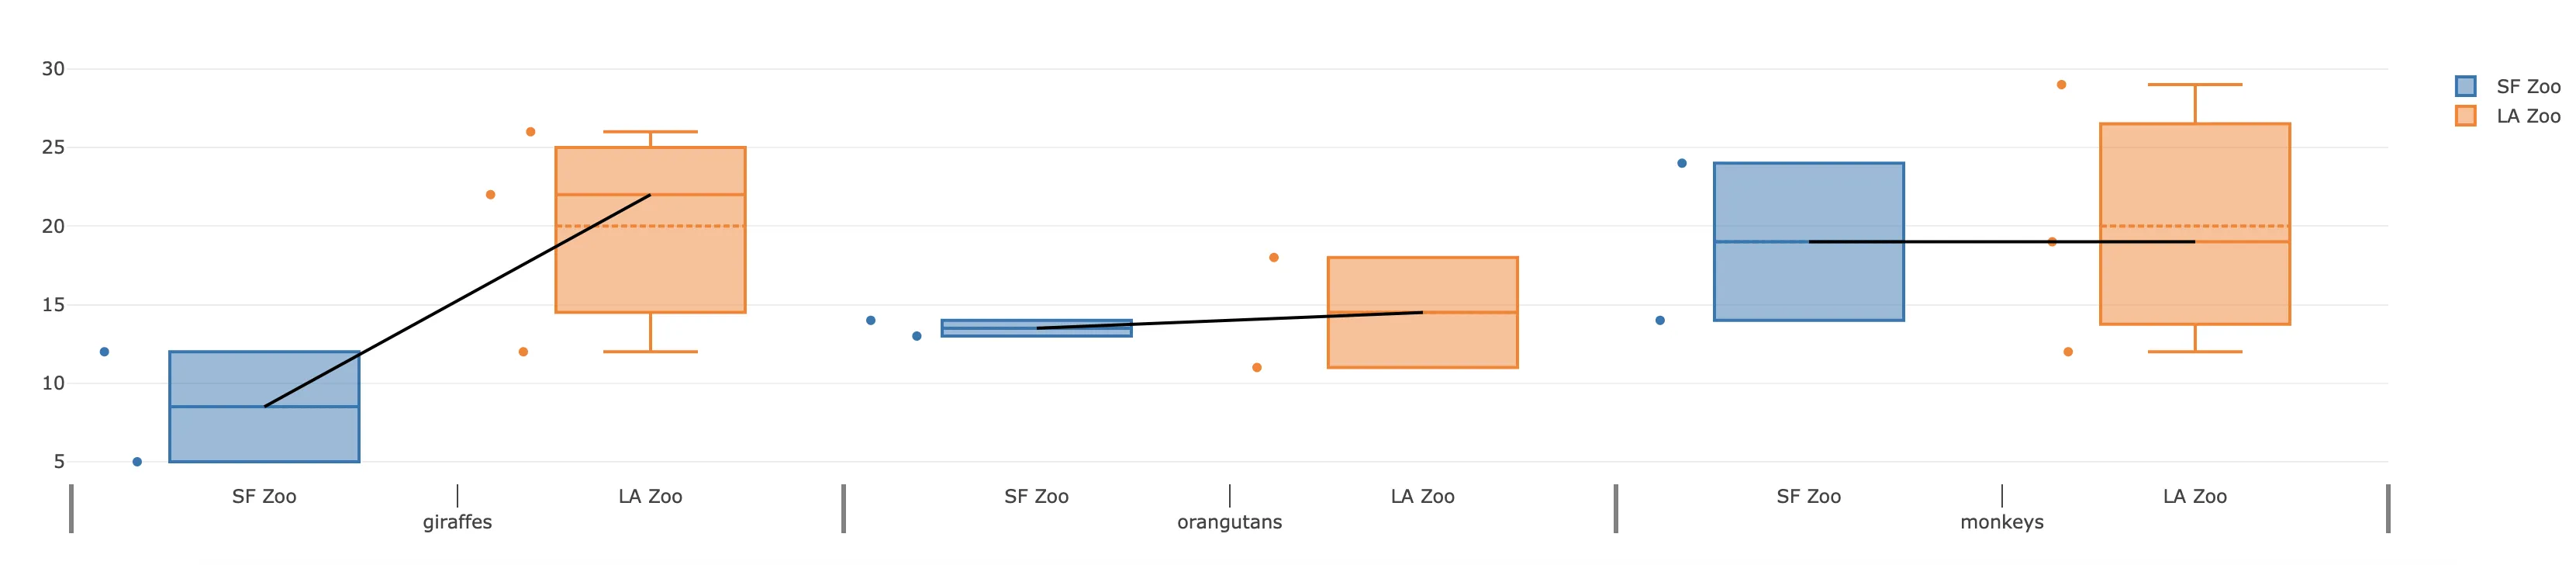
我已经进行了一些研究,但是我的x轴有多个分类!!

Shiny:如何在Plotly中的箱形图上添加中位数线?

Plotly:如何在箱形图上添加中位数线

enter image description here

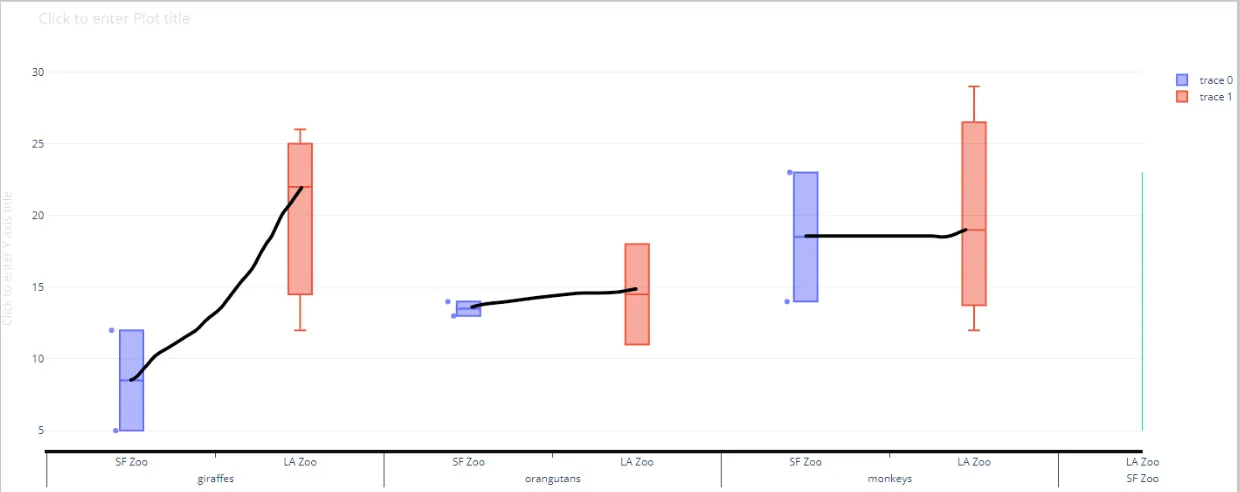
Here is the code I've used. Ofcourse modified little bit to represent the actual plot that I want to have. https://plotly.com/javascript/axes/

var trace1 = {
  x: [
    
    ['giraffes', 'orangutans', 'monkeys','giraffes', 'orangutans', 'monkeys'],
    ['SF Zoo','SF Zoo','SF Zoo','SF Zoo','SF Zoo','SF Zoo']
  ],
  y: [5, 14, 23,12,13,14],
   boxpoints: 'all',
  name: 'SF Zoo',
  type: 'box',
  boxmean:true

};

var trace2 = {
  x: [
     ['giraffes', 'orangutans', 'monkeys','giraffes', 'orangutans', 'monkeys','monkeys','giraffes'],
    ['LA Zoo','LA Zoo','LA Zoo','LA Zoo','LA Zoo','LA Zoo','LA Zoo','LA Zoo']
  ],
  y: [12, 18, 29,22,11,19,12,26],
  //name: 'LA Zoo',
  type: 'box',
  boxmean:true,
  name: 'LA Zoo',

  boxpoints: 'all'
  
};

var x= [
    ['LA Zoo','LA Zoo','LA Zoo','LA Zoo','LA Zoo','LA Zoo','LA Zoo','LA Zoo'],
    ['giraffes', 'orangutans', 'monkeys','giraffes', 'orangutans', 'monkeys','monkeys','giraffes']
  ];

var y = [12, 18, 29,22,11,19,12,26];

var connecting_means = [{
  type: 'scatter',
  x: x,
  y: y,
  //mode: 'line',
  transforms: [{
    type: 'aggregate',
    groups: x,
    aggregations: [
      {target: 'y', func: 'mean', enabled: true}]}]
}];

var data = [trace1, trace2,connecting_means];
var layout = {
  showlegend: true,
  xaxis: {
    tickson: "boundaries",
    ticklen: 15,
    showdividers: true,
    dividercolor: 'grey',
    dividerwidth: 3
  }
};


Plotly.newPlot('myDiv', data, layout,connecting_means);
<head>
    <!-- Load plotly.js into the DOM -->
    <script src='https://cdn.plot.ly/plotly-2.4.2.min.js'></script>
</head>

<body>
    <div id='myDiv'><!-- Plotly chart will be drawn inside this DIV --></div>
</body>


据我所知,我们没有那个功能,那么怎么样加上一种注释行的方式呢? - r-beginners
@r-beginners 你是plotly的开发者之一吗?"annotate lines" 是什么意思? - Alexander
不,我没有参与plotly的开发。 - r-beginners
@r-beginners 如果是这样,为什么你说“我们没有那个功能”? - Alexander
我可能选错了词。我的意思是,我没有看到任何示例或特性。 - r-beginners
1个回答

1
如@r-beginners所评论的那样,Plotly不能提取箱线图的统计数据(例如中位数或四分位数)。因此,您需要手动计算每个箱子的中位数,并将箱子之间的线条绘制为轨迹。
这里是一个在Plotly.js中的解决方案,我们为每个单独的箱线图创建数组,使用@JBallin编写的median函数找到它们的中位数,并使用额外的轨迹将它们连接起来。我重新组织了您的数据,并使用循环连接了每个类别中的箱子。您可以在这里找到代码。
var giraffe_sf = [5,12]
var giraffe_la = [12,22,26]
var orang_sf = [13,14]
var orang_la = [18,11]
var monkeys_sf = [14,24]
var monkeys_la = [29,19,12]

sf_y = giraffe_sf.concat(orang_sf, monkeys_sf)
la_y = giraffe_la.concat(orang_la, monkeys_la)

var categories = ['giraffes', 'orangutans', 'monkeys']
var all_data = [[giraffe_sf, giraffe_la], [orang_sf, orang_la], [monkeys_sf, monkeys_la]]

function median(numbers) {
    const sorted = numbers.slice().sort((a, b) => a - b);
    const middle = Math.floor(sorted.length / 2);

    if (sorted.length % 2 === 0) {
        return (sorted[middle - 1] + sorted[middle]) / 2;
    }

    return sorted[middle];
}

// sort the arrays
var trace1 = {
  x: [
    ['giraffes', 'giraffes', 'orangutans', 'orangutans', 'monkeys', 'monkeys'],
    ['SF Zoo','SF Zoo','SF Zoo','SF Zoo','SF Zoo','SF Zoo']
  ],
  y: sf_y,
   boxpoints: 'all',
  name: 'SF Zoo',
  type: 'box',
  boxmean:true

};

var trace2 = {
  x: [
     ['giraffes', 'giraffes', 'giraffes', 'orangutans', 'orangutans', 'monkeys','monkeys', 'monkeys'],
    ['LA Zoo','LA Zoo','LA Zoo','LA Zoo','LA Zoo','LA Zoo','LA Zoo','LA Zoo']
  ],
  y: la_y,
  type: 'box',
  boxmean:true,
  name: 'LA Zoo',
  boxpoints: 'all'
};

var data = [trace1, trace2];

for (let i = 0; i < categories.length; i++) {
  trace = {
    x: [
      [categories[i], categories[i]],
      ['SF Zoo','LA Zoo']
    ],
    y: [median(all_data[i][0]),median(all_data[i][1])],
    mode: 'lines',
    type: 'scatter',
    marker: {color: 'black'},
    showlegend: false
  }
  data.push(trace)
};

var layout = {
  showlegend: true,
  xaxis: {
    tickson: "boundaries",
    ticklen: 15,
    showdividers: true,
    dividercolor: 'grey',
    dividerwidth: 3
  }
};

Plotly.newPlot('myDiv', data, layout);

enter image description here


谢谢 Derek。我认为将其转换为 ploly python 应该很简单。我认为 Python 中已经内置了中位数函数。 - Alexander
哦,那是我的错误:我没有仔细阅读你的问题,认为你想要使用plotly.js,但在plotly-python中确实有几个不同的包含中位数的包,因此解决方案应该是相似的。 - Derek O

网页内容由stack overflow 提供, 点击上面的
可以查看英文原文,
原文链接