随机效应的点图

4

我有一个广义混合效应模型,如下所示:

d <- data.frame(
    g = sample(c("A","B","C","D","E"), 250, replace=TRUE),
    x = runif(250, max=100),
    y = sample(c(0,1), 250, replace=TRUE)
)

require(lme4)

fm <- lmer(y ~ x + (1 + x | g), data=d, family=binomial)

我想使用
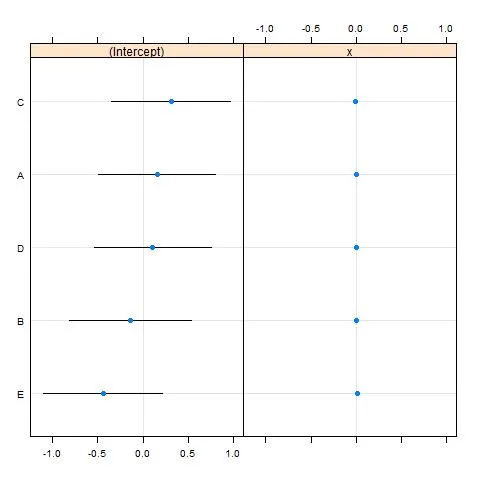
dotplot绘制截距的随机效应,但不绘制x的随机斜率组件。 我的问题是我似乎无法弄清如何仅访问截距分量而不是随机斜率。
例如,我想要此图的左侧:
dotplot(ranef(fm, postVar=TRUE))

enter image description here

使用 dotplot(ranef(fm, postVar=TRUE)$g[,2]) 并不能得到我想要的结果,尽管我认为应该可以! 我已经查看了str(fm),但没有看到任何有助于我接近的东西。

非常感谢您的任何帮助和提示!

4个回答

3
你的原始代码已经很接近了:

你几乎完成了原始代码:

dotplot(ranef(fm, postVar=TRUE))$g[1]

每个图表都有清除比例尺的额外提示:
dotplot(ranef(fm, postVar=TRUE),
        scales = list(x =list(relation = 'free')))

2
你只需要更聪明地删除那个随机效果的列即可:
re <- ranef(fm,postVar = TRUE)
re$g$x <- NULL
dotplot(re)

你之前的方法没有生效是因为dotplot方法仍然期望输入看起来像一个元素列表,就像从ranef中获取的一样。所以你只需要去除那个有问题的列,但是保留结构的其他部分即可。

2
您没有查看正确对象的str()。
re <- ranef(fm, postVar = TRUE)
str(re)

这将显示一个列表,其中第一项是包含所需内容的数据框。我只需要从中删除$x$列。

re[[1]]$x <- NULL

2
这应该可以让你接近想要的。我一直想为 coefplot 添加对 lme4 对象的支持,也许这会成为我的催化剂。
theRan <- ranef(fm, postVar=TRUE)
pv <- attr(theRan$g, "postVar")
se <- pv[1, 1, ]
theIntercepts <- theRan$g[, 1, drop=F]
theFrame <- cbind(theIntercepts, se)
names(theFrame)[1] <- "Intercept"
theFrame$Low <- with(theFrame, Intercept - 2 * se)
theFrame$High <- with(theFrame, Intercept + 2 * se)
theFrame$Variable <- rownames(theFrame)
ggplot(theFrame, aes(y=Intercept, x=reorder(Variable, Intercept))) + geom_linerange(aes(ymin=Low, ymax=High), colour="black") + geom_point(, colour="blue") + coord_flip() + labs(y="Intercept", x=NULL)

网页内容由stack overflow 提供, 点击上面的
可以查看英文原文,
原文链接