使用单独指定的颜色绘制每个刻度线。

4
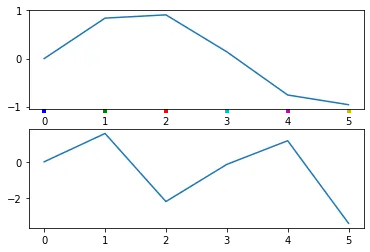
我正在尝试更改绘图中刻度线的颜色,我希望根据一个包含颜色代码的字符串列表来分配颜色。我按照以下方法进行操作,但我不明白为什么不起作用:
import numpy as np
import matplotlib.pyplot as plt
x = [0, 1, 2, 3, 4, 5]
y = np.sin(x)
y2 = np.tan(x)
fig = plt.figure()
ax1 = fig.add_subplot(2, 1, 1)
ax1.plot(x, y)
ax2 = fig.add_subplot(2, 1, 2)
ax2.plot(x, y2)
colors = ['b', 'g', 'r', 'c', 'm', 'y']
ax1.set_xticks(x)
for tick, tickcolor in zip(ax1.get_xticklines(), colors):
    tick._color = tickcolor
plt.show()

有人知道这个的正确实施方法吗?

2
也许与GH25522有关。 - undefined
2个回答

2
如评论中所指出,tick._color/tick.set_color(tickcolor)由于一个bug而无法正常工作:
使用tick.set_markeredgecolor是一种解决方法,但似乎并不是唯一的问题。ax1.get_xticklines()会返回每两个项目上的实际刻度线,因此您应该只对它们进行zip操作:
for tick, tickcolor in zip(ax1.get_xticklines()[::2], colors):
    tick.set_markeredgecolor(tickcolor)

输出:

enter image description here

NB. 也可以更改勾的宽度以更好地显示颜色。

完整代码:

import numpy as np
import matplotlib.pyplot as plt
x = [0, 1, 2, 3, 4, 5]
y = np.sin(x)
y2 = np.tan(x)
fig = plt.figure()
ax1 = fig.add_subplot(2, 1, 1)
ax1.plot(x, y)
ax2 = fig.add_subplot(2, 1, 2)
ax2.plot(x, y2)
colors = ['b', 'g', 'r', 'c', 'm', 'y']
ax1.set_xticks(x)
for tick, tickcolor in zip(ax1.get_xticklines()[::2], colors):
    tick.set_markeredgecolor(tickcolor)
    tick.set_markeredgewidth(4)
plt.show()

1
一个不太可靠的方法是这样的:
import numpy as np
import matplotlib.pyplot as plt
x = [0, 1, 2, 3, 4, 5]
y = np.sin(x)
y2 = np.tan(x)
fig = plt.figure()
ax1 = fig.add_subplot(2, 1, 1)
ax1.plot(x, y)
ax2 = fig.add_subplot(2, 1, 2)
ax2.plot(x, y2)
colors = ['b', 'g', 'r', 'c', 'm', 'y']
ax1.set_xticks(x)
for tick, tickcolor in zip(ax1.xaxis.majorTicks, colors):
    tick._apply_params(color=tickcolor)
plt.show()

enter image description here

我认为这有点靠不住,因为我依赖一个以下划线开头的“私有”方法。

网页内容由stack overflow 提供, 点击上面的
可以查看英文原文,
原文链接