在创建Axes之后,是否可能设置matplotlib子图的大小和位置?我知道可以这样做:
import matplotlib.pyplot as plt

ax = plt.subplot(111)
ax.change_geometry(3,1,1)
将三个图表的坐标轴放在顶部。但我希望坐标轴跨越前两行。我尝试过以下方法:
import matplotlib.gridspec as gridspec
ax = plt.subplot(111)
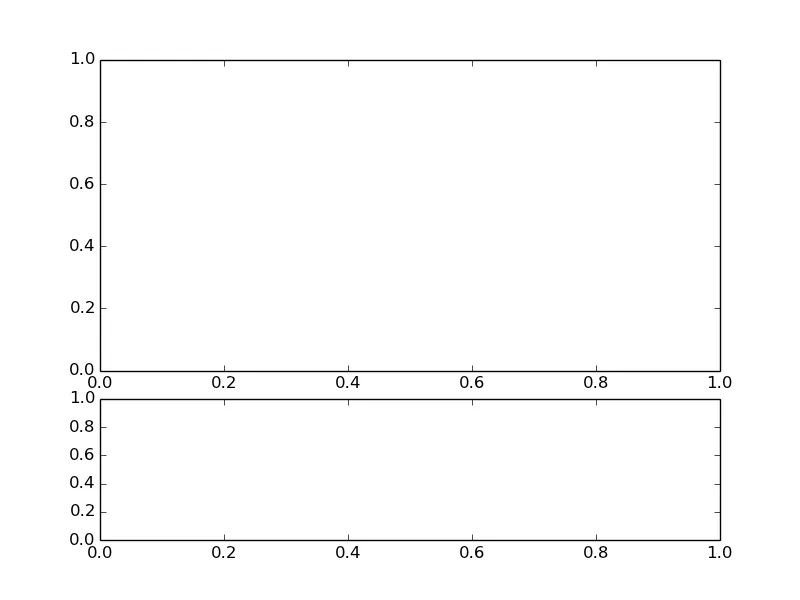
gs = gridspec.GridSpec(3,1)
ax.set_subplotspec(gs[0:2])
但是坐标轴仍然填满整个窗口。
澄清更新 我想改变现有坐标轴实例的位置而不是在创建时设置它。这是因为每次添加数据时(使用cartopy在地图上绘制数据),坐标轴的范围将被修改。地图可能会变得高而窄,或短而宽(或介于两者之间)。因此,网格布局的决定将在绘图函数之后发生。