我正在尝试开发一种快速算法,用Python在图像中查找峰值并找到这些峰值的质心。我使用scipy.ndimage.label和ndimage.find_objects编写了以下代码来定位对象。这似乎是代码的瓶颈,在一个500x500的图像中定位20个对象需要大约7毫秒。我想将其扩展到更大的(2000x2000)图像,但时间增加到近100毫秒。因此,我想知道是否有更快的选项。
以下是我目前拥有的代码,它能够工作,但速度很慢。首先,我使用一些高斯峰模拟我的数据。这部分很慢,但在实践中,我将使用真实数据,所以我不太关心加速那部分。我希望能够快速找到峰值。
size=500的结果如下: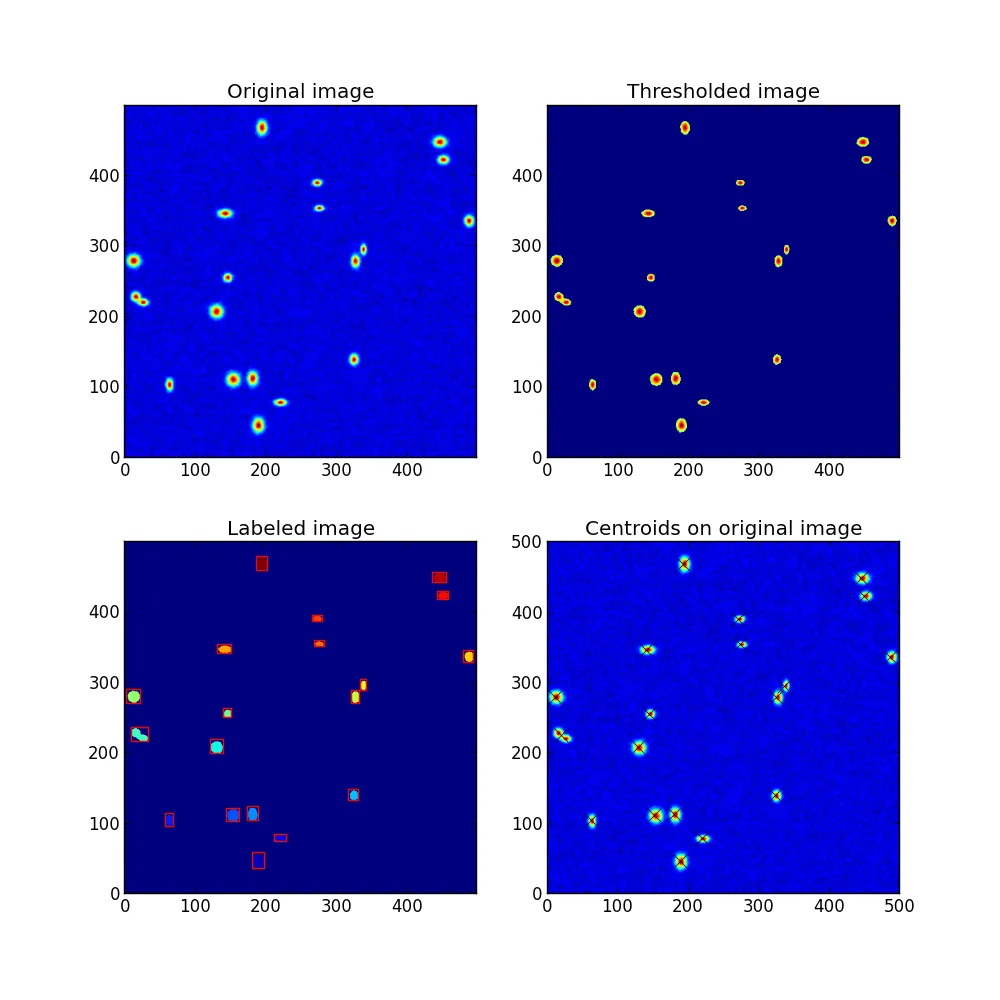 编辑:如果峰数量较大(~100)且图像尺寸较小,则瓶颈实际上是重心定位部分。因此,也许需要优化这一部分的速度。
以下是我目前拥有的代码,它能够工作,但速度很慢。首先,我使用一些高斯峰模拟我的数据。这部分很慢,但在实践中,我将使用真实数据,所以我不太关心加速那部分。我希望能够快速找到峰值。
import time
import numpy as np
import matplotlib.pyplot as plt
import scipy.ndimage
import matplotlib.patches

plt.figure(figsize=(10,10))
ax1 = plt.subplot(221)
ax2 = plt.subplot(222)
ax3 = plt.subplot(223)
ax4 = plt.subplot(224)

size        = 500 #width and height of image in pixels
peak_height = 100 # define the height of the peaks
num_peaks   = 20
noise_level = 50
threshold   = 60

np.random.seed(3)

#set up a simple, blank image (Z)
x = np.linspace(0,size,size)
y = np.linspace(0,size,size)

X,Y = np.meshgrid(x,y)
Z = X*0

#now add some peaks
def gaussian(X,Y,xo,yo,amp=100,sigmax=4,sigmay=4):
    return amp*np.exp(-(X-xo)**2/(2*sigmax**2) - (Y-yo)**2/(2*sigmay**2))

for xo,yo in size*np.random.rand(num_peaks,2):
    widthx = 5 + np.random.randn(1)
    widthy = 5 + np.random.randn(1)
    Z += gaussian(X,Y,xo,yo,amp=peak_height,sigmax=widthx,sigmay=widthy)

#of course, add some noise:
Z = Z + scipy.ndimage.gaussian_filter(0.5*noise_level*np.random.rand(size,size),sigma=5)
Z = Z + scipy.ndimage.gaussian_filter(0.5*noise_level*np.random.rand(size,size),sigma=1)

t = time.time() #Start timing the peak-finding algorithm

#Set everything below the threshold to zero:
Z_thresh = np.copy(Z)
Z_thresh[Z_thresh<threshold] = 0
print 'Time after thresholding: %.5f seconds'%(time.time()-t)

#now find the objects
labeled_image, number_of_objects = scipy.ndimage.label(Z_thresh)
print 'Time after labeling: %.5f seconds'%(time.time()-t)

peak_slices = scipy.ndimage.find_objects(labeled_image)
print 'Time after finding objects: %.5f seconds'%(time.time()-t)

def centroid(data):
    h,w = np.shape(data)
    x = np.arange(0,w)
    y = np.arange(0,h)

    X,Y = np.meshgrid(x,y)

    cx = np.sum(X*data)/np.sum(data)
    cy = np.sum(Y*data)/np.sum(data)

    return cx,cy

centroids = []

for peak_slice in peak_slices:
    dy,dx  = peak_slice
    x,y = dx.start, dy.start
    cx,cy = centroid(Z_thresh[peak_slice])
    centroids.append((x+cx,y+cy))

print 'Total time: %.5f seconds\n'%(time.time()-t)

###########################################
#Now make the plots:
for ax in (ax1,ax2,ax3,ax4): ax.clear()
ax1.set_title('Original image')
ax1.imshow(Z,origin='lower')

ax2.set_title('Thresholded image')
ax2.imshow(Z_thresh,origin='lower')

ax3.set_title('Labeled image')
ax3.imshow(labeled_image,origin='lower') #display the color-coded regions

for peak_slice in peak_slices:  #Draw some rectangles around the objects
    dy,dx  = peak_slice
    xy     = (dx.start, dy.start)
    width  = (dx.stop - dx.start + 1)
    height = (dy.stop - dy.start + 1)
    rect = matplotlib.patches.Rectangle(xy,width,height,fc='none',ec='red')
    ax3.add_patch(rect,)

ax4.set_title('Centroids on original image')
ax4.imshow(Z,origin='lower')

for x,y in centroids:
    ax4.plot(x,y,'kx',ms=10)

ax4.set_xlim(0,size)
ax4.set_ylim(0,size)

plt.tight_layout
plt.show()
size=500的结果如下:
编辑:如果峰数量较大(~100)且图像尺寸较小,则瓶颈实际上是重心定位部分。因此,也许需要优化这一部分的速度。