我想在我的六边形图上添加一个标准的1:1线(截距为0,斜率为1)和一些文本(例如R平方)。试用代码可能是这样的
require(hexbin)
x1 <- rnorm(10000)
x2 <- rnorm(10000)
df <- data.frame(cbind(x1, x2))
hex <- hexbin(x1, x2, xbins = 300)
hexbinplot(x2 ~ x1, data = df, aspect = '1', xbins = 300, xlim = c(-5, 5), ylim = c(-5, 5))
hexVP.abline(hexViewport(hex), 0, 1)
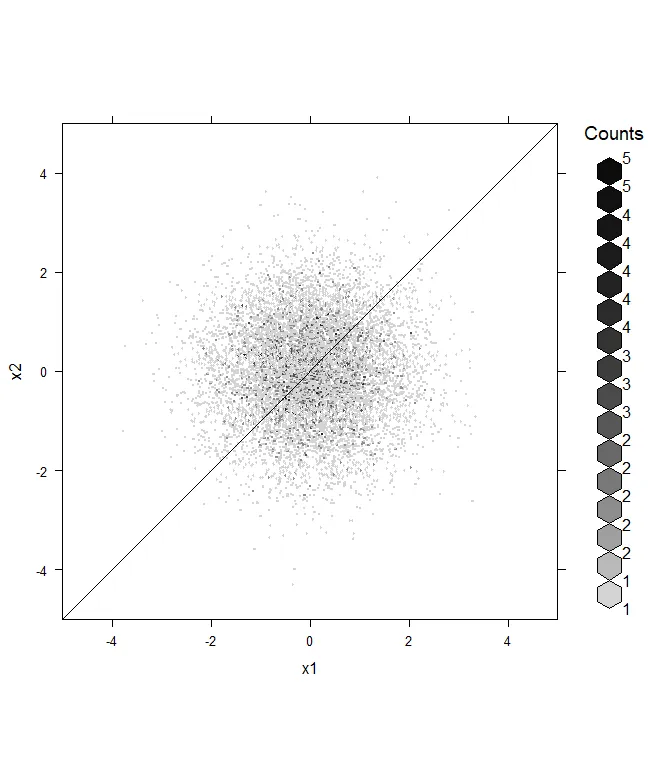
这给我下面的图表
 添加的线有两个问题:
- 它应该从左下角到右上角,但是当我在RStudio中缩放图形窗口时,斜率(应为1)和截距(应为0)似乎发生了变化
- 线的两端未延伸到图表边界
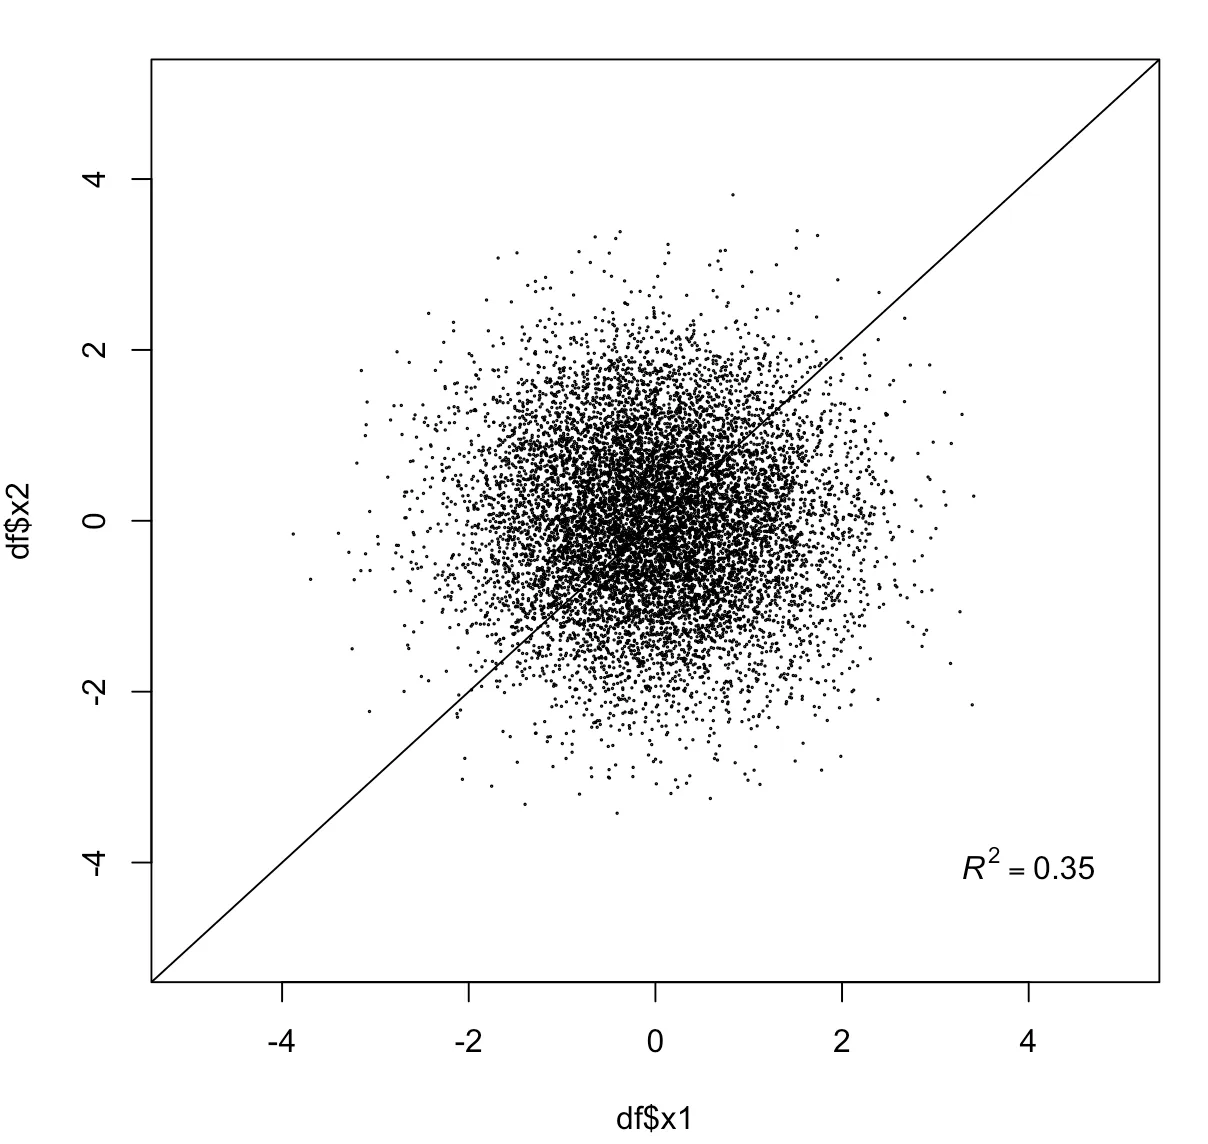
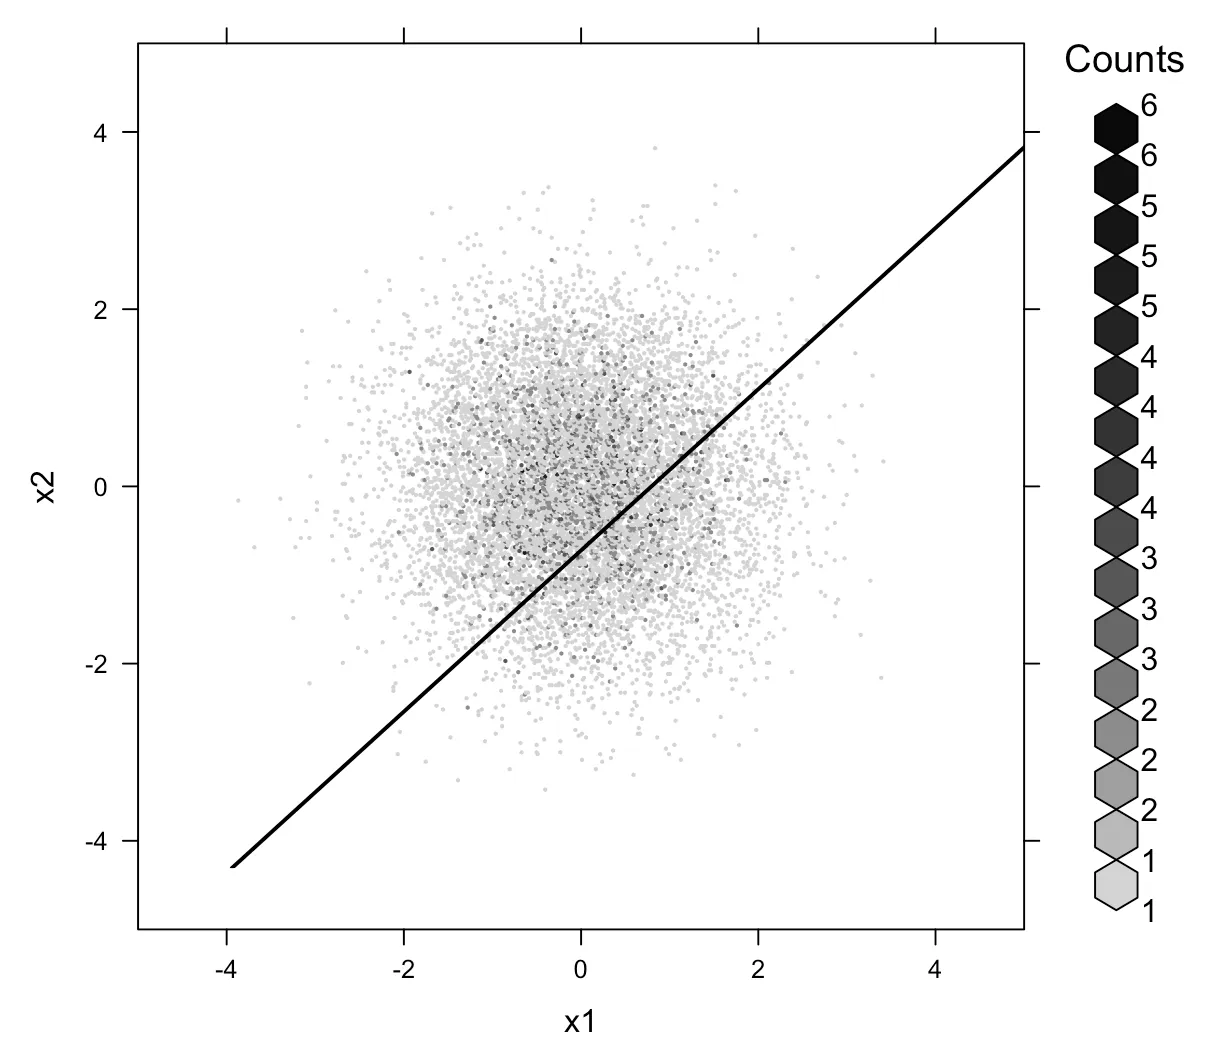
理想的图表可能看起来像