我正在使用R中的ggmap包,相对于地理空间数据可视化而言,我还是新手。我有一个包含11个纬度和经度对的数据框,我想在地图上绘制它们,每个点上带有标签。以下是虚拟数据:
lat<- c(47.597157,47.656322,47.685928,47.752365,47.689297,47.628128,47.627071,47.586349,47.512684,47.571232,47.562283)

lon<-c(-122.312187,-122.318039,-122.31472,-122.345345,-122.377045,-122.370117,-122.368462,-122.331734,-122.294395,-122.33606,-122.379745)

labels<-c("Site 1A","Site 1B","Site 1C","Site 2A","Site 3A","Site 1D","Site 2C","Site 1E","Site 2B","Site 1G","Site 2G")

df<-data.frame(lat,lon,labels)
现在我使用annotate创建数据点标签,并将其绘制在地图上。
map.data <- get_map(location = c(lon=-122.3485,lat=47.6200),
                    maptype = 'roadmap', zoom = 11)

pointLabels<-annotate("text",x=uniqueReach$lon,y=c(uniqueReach$lat),size=5,font=3,fontface="bold",family="Helvetica",label=as.vector(uniqueReach$label))

dataPlot <- ggmap(map.data) +
 geom_point(data = uniqueReach,aes(x = df$lon, y = df$lat), alpha = 1,fill="red",pch=21,size = 6) + labs(x = 'Longitude', y = 'Latitude')+pointLabels
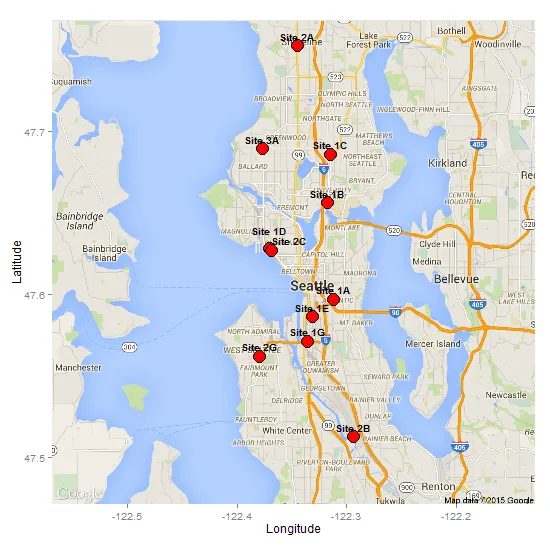
这将生成数据点的图形 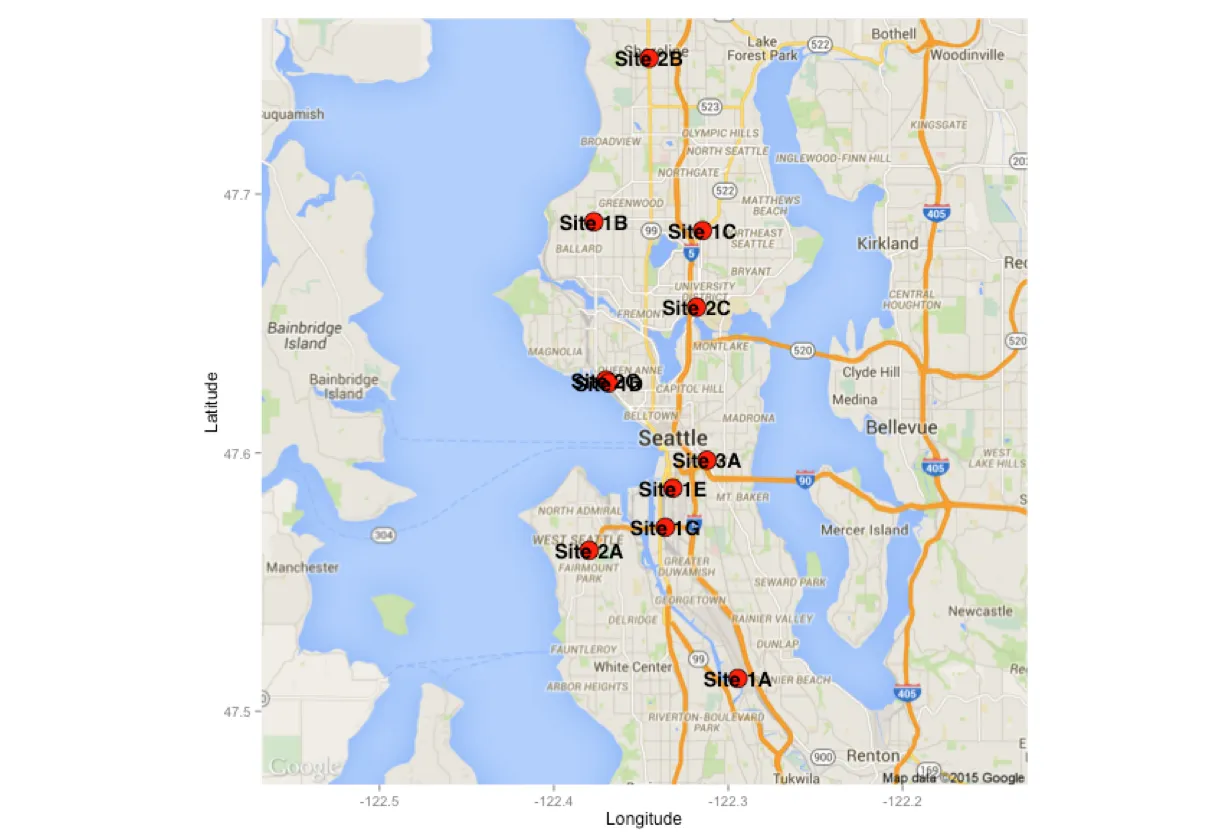
从图中可以看出,有两个数据点在(-122.44,47.63)附近重叠,并且它们的标签也重叠。现在我可以手动添加每个标签点的偏移量,以防止标签重叠(请参见此帖子),但当我需要为不同的经度和纬度对产生许多这样的图时,这不是一个很好的技术。
有没有一种方法可以自动避免数据标签重叠?我意识到标签是否重叠取决于实际的图形大小,因此如果需要,我可以固定图形尺寸在某些维度上。谢谢您提前的任何见解!
编辑
以下是使用Sandy Mupratt给出的答案修改后的代码
# Defining function to draw text boxes
draw.rects.modified <- function(d,...){
  if(is.null(d$box.color))d$box.color <- NA
  if(is.null(d$fill))d$fill <- "grey95"
  for(i in 1:nrow(d)){
    with(d[i,],{
      grid.rect(gp = gpar(col = box.color, fill = fill,alpha=0.7),
                vp = viewport(x, y, w, h, "cm", c(hjust, vjust=0.25), angle=rot))
    })
  }
  d
}


# Defining function to determine text box borders
enlarge.box.modified <- function(d,...){
  if(!"h"%in%names(d))stop("need to have already calculated height and width.")
  calc.borders(within(d,{
    w <- 0.9*w
    h <- 1.1*h
  }))
}
生成绘图:
dataplot<-ggmap(map.data) +
geom_point(data = df,aes(x = df$lon, y = df$lat),
alpha = 1, fill = "red", pch = 21, size = 6) +
labs(x = 'Longitude', y = 'Latitude') +
geom_dl(data = df,
aes(label = labels),
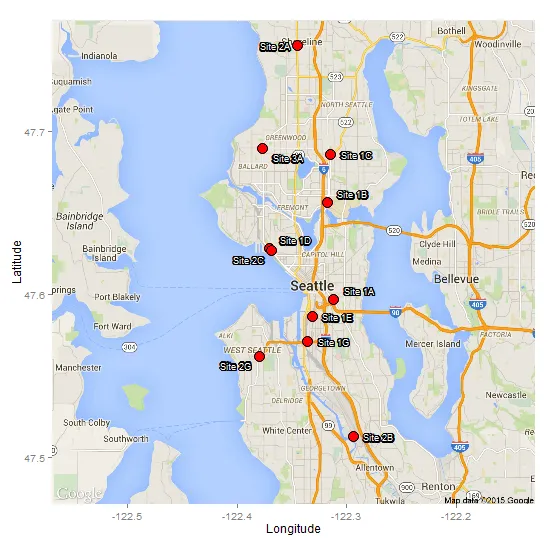
list(dl.trans(y = y + 0.3), "boxes", cex = .8, fontface = "bold"))
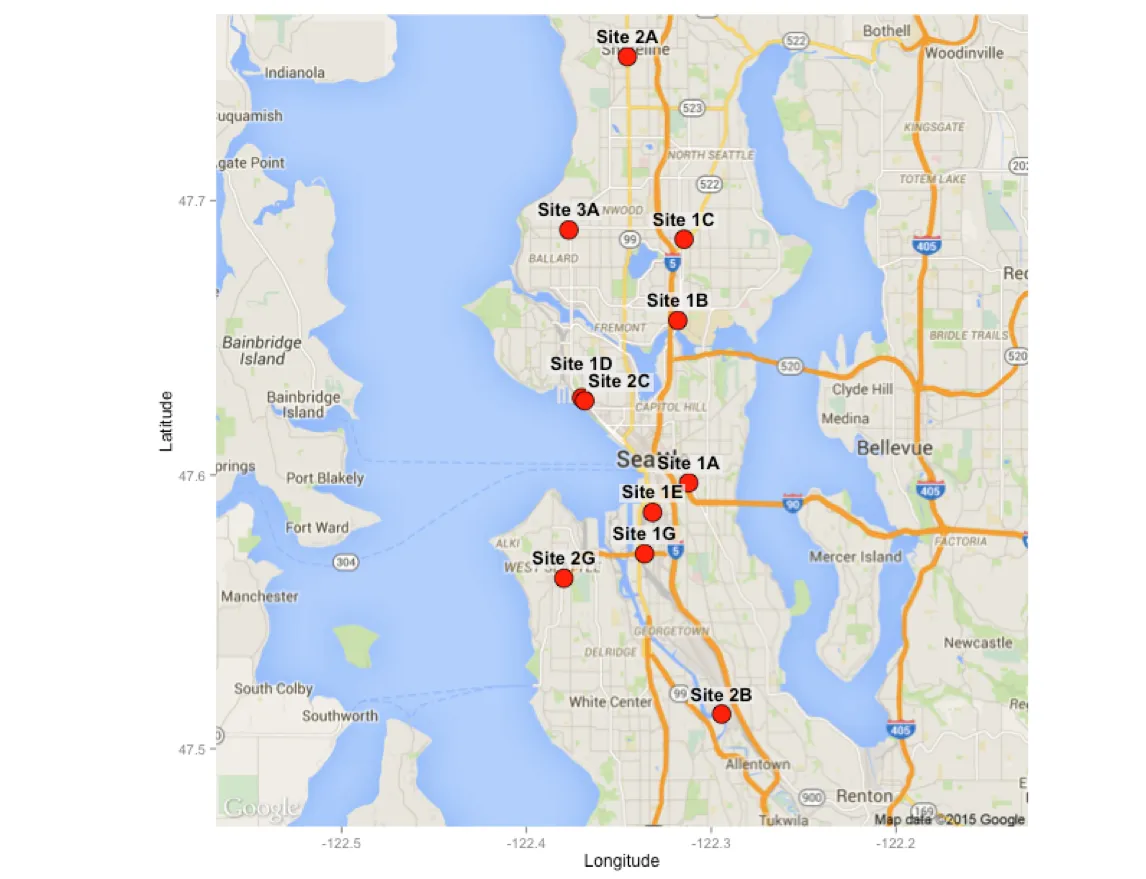
这是一个更易读的图,但仍存在一个显着问题。注意到标签“Site 1E”开始与关联到“Site 1A”的数据点重叠。Directlabels有办法解决标签重叠到其他标签的数据点的问题吗?
最后,我有一个问题:如何使用此方法绘制多个重复标签。假设data.frame的标签都是相同的:
df$labels<-rep("test",dim(df)[1])
当我使用相同的代码时,directlabels会删除重复的标签名称:
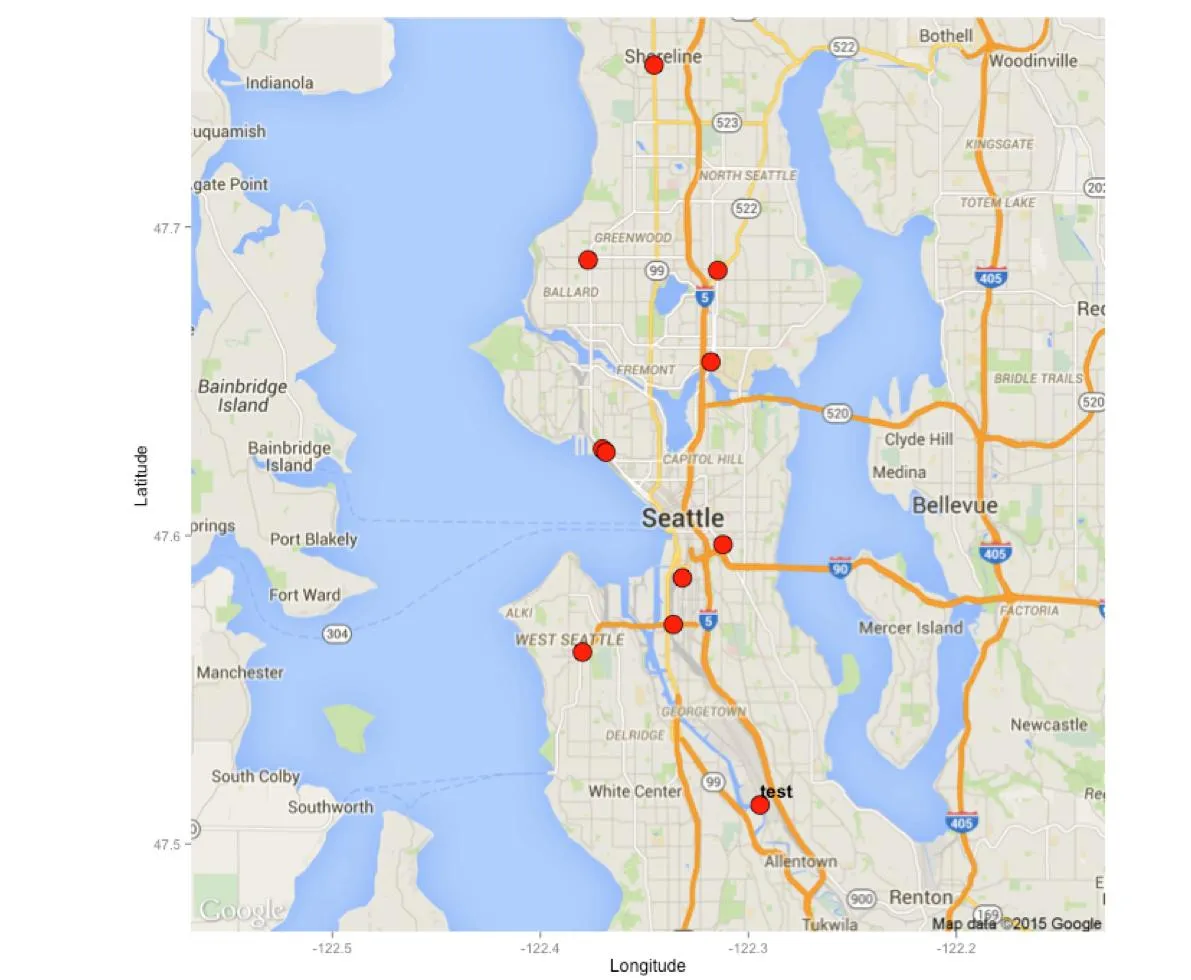 但是我希望每个数据点都有一个"label"为"test"。有什么建议吗?
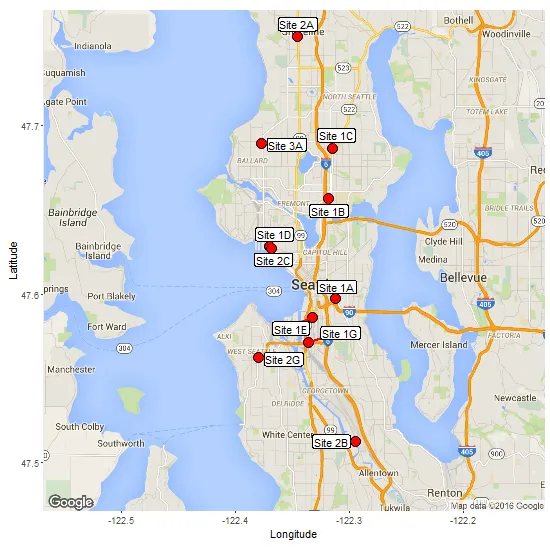

list(dl.trans(y = y + 0.2)对于控制标签位置以及仍然使用geom_dl的功能非常关键。除了“Site 1A”标签与底层图中的“Seattle”单词重叠之处,此图表将是完美的。如果有任何解决此问题的建议,将不胜感激。 - Archimeowmaptools包中的pointLabel()函数时,在散点图方面取得了一些成功。我已经添加了另一个编辑 - 在添加轮廓部分。 - Sandy Muspratt