我不了解 OpenStreetMap 包。但是我提供一种替代方法,仍然绘制一个 OpenStreet Map,但使用 ggmap 包来获取和绘制地图。 get_map 函数可以从多个来源获取地图:osm、google、stamen 和 cloudmade;用 source 设置。此外,这些来源具有不同的样式,用 maptype 设置。地图的边界由位置向量给出。或者,位置向量可以给出地图的中心,并设置适当的缩放级别。地图是使用 ggplot2 绘制的,因此点和标签可以添加到地图上,就好像它们被添加到任何 ggplot 对象上一样。要运行以下内容,需要安装 ggmap 和 ggplot2 包。
library(ggmap)
stores <- data.frame(name=c("Commercial","Union","Bedford"),
longitude=c(-70.25042295455933,-70.26050806045532,-70.27726650238037),
latitude=c(43.657471302616806,43.65663299041943,43.66091757424481))
location = c(-70.2954, 43.64278, -70.2350, 43.68093)
portland = get_map(location = location, source = "osm")
portlandMap = ggmap(portland)
portlandMap = portlandMap + geom_point(data = stores, aes(x = longitude, y = latitude), size = 5)
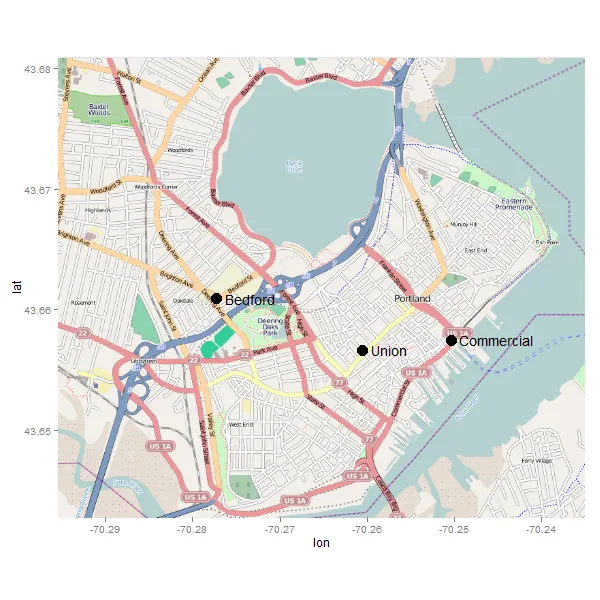
portlandMap + geom_text(data = stores, aes(label = name, x = longitude+.001, y = latitude), hjust = 0)
结果如下:
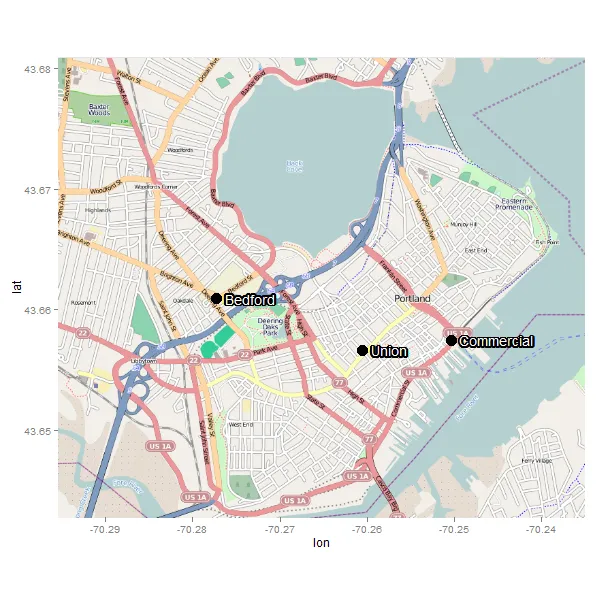
标签可能会被背景覆盖,此时可以考虑像这样做。它使用这里的代码为文本添加轮廓。
portlandMap = ggmap(portland) + geom_point(data = stores, aes(x = longitude, y = latitude), size = 5)

theta <- seq(pi/16, 2*pi, length.out=32)
xo <- diff(location[c(1,3)])/250
yo <- diff(location[c(2,4)])/250

for(i in theta) {
    portlandMap <- portlandMap + geom_text(data = stores,
    aes_(x = stores$longitude + .001 + cos(i) * xo,
         y = stores$latitude + sin(i) * yo,
         label = stores$name),
    size = 5, colour = 'black', hjust = 0)
 }

portlandMap +
   geom_text(data = stores, aes(x = longitude + .001, y = latitude, label=name),
     size = 5, colour = 'white', hjust = 0)
get_map时出现错误。Error: 'get_openstreetmap' is defunct。请参见https://github.com/dkahle/ggmap/issues/117。 - tlask