我该如何生成一个B样条曲面,比如说:
x=attitude$rating
y=attitude$complaints
z=attitude$privileges
将来的样条基础将会是x和y。z是控制点集合。
akima包中使用interp(...)来实现这一点。library(akima)
spline <- interp(x,y,z,linear=FALSE)
# rotatable 3D plot of points and spline surface
library(rgl)
open3d(scale=c(1/diff(range(x)),1/diff(range(y)),1/diff(range(z))))
with(spline,surface3d(x,y,z,alpha=.2))
points3d(x,y,z)
title3d(xlab="rating",ylab="complaints",zlab="privileges")
axes3d()
由于x、y和x高度相关,因此数据集本身的情节相当无聊。
编辑 回复OP的评论。
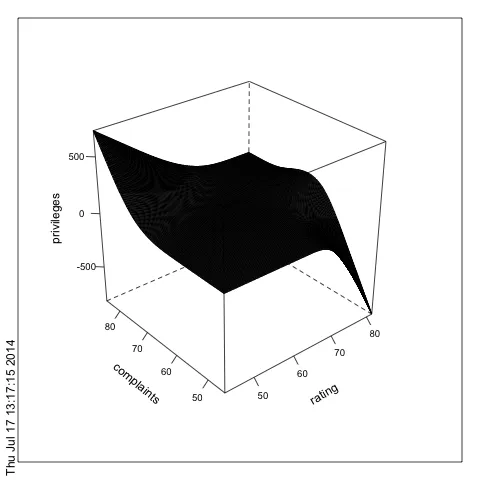
如果您想要一个B样条曲面,请尝试使用不幸命名的MBA包中的mba.surf(...)。
library(MBA)
spline <- mba.surf(data.frame(x,y,z),100,100)

library(rgl)
open3d(scale=c(1/diff(range(x)),1/diff(range(y)),1/diff(range(z))))
with(spline$xyz,surface3d(x,y,z,alpha=.2))
points3d(x,y,z)
title3d(xlab="rating",ylab="complaints",zlab="privileges")
axes3d()
mba.surf(...) 的文档。在示例中,apline$xyz$z 是插值 s 值的矩阵。 - jlhoward require(rms) # Harrell's gift to the R world.
# Better to keep the original names and do so within a dataframe.
att <- attitude[c('rating','complaints','privileges')]
add <- datadist(att) # records ranges and descriptive info on data
options(datadist="add") # need these for the rms functions
# rms-`ols` function (ordinary least squares) is a version of `lm`
mdl <- ols( privileges ~ rcs(rating,4)*rcs(complaints,4) ,data=att)
# Predict is an rms function that works with rms's particular classes
pred <- Predict(mdl, 'rating','complaints')
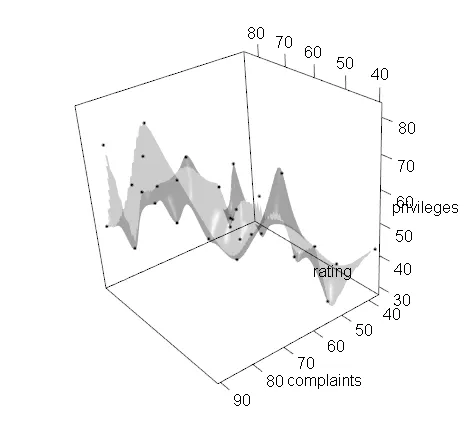
# bplot calls lattice functions; levelplot by default; this gives a "3d" plot
bplot(pred, yhat~rating+complaints, lfun=wireframe)
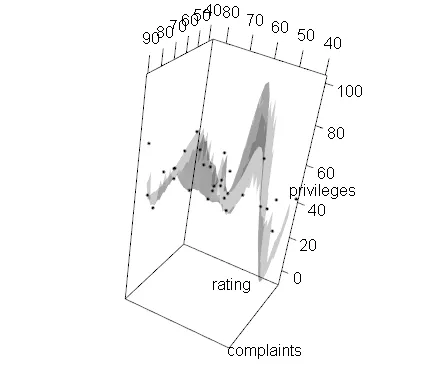
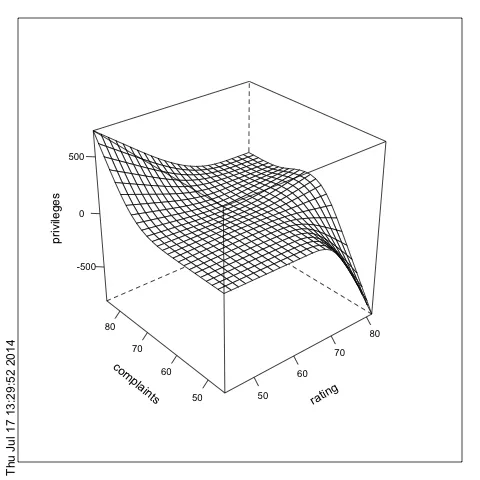
这是一个交叉限制立方样条模型。如果你想使用自己喜欢的样条函数,那么请尝试一下。我使用rcs函数的效果很好。
这将得到一个更开放的网格,并且计算点更少:
pred <- Predict(mdl, 'rating','complaints', np=25)
bplot(pred, yhat~rating+complaints, lfun=wireframe)
png()
bplot(pred, yhat~rating+complaints, lfun=wireframe)
dev.off()
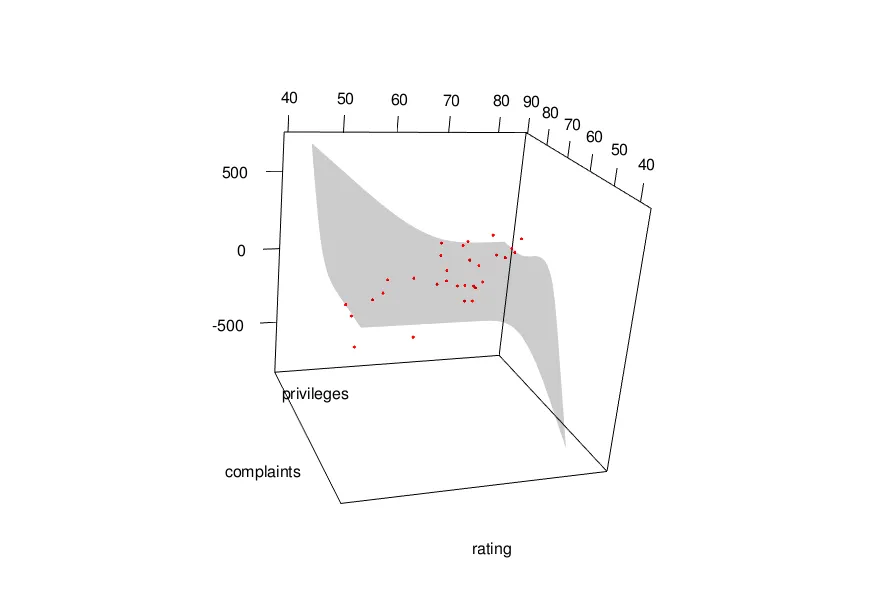
您可以使用jhoward演示的rgl方法。 str(pred)的顶部如下所示:
 str(pred)
Classes ‘Predict’ and 'data.frame': 625 obs. of  5 variables:
 $ rating    : num  43 44.6 46.2 47.8 49.4 ...
 $ complaints: num  45 45 45 45 45 ...
 $ yhat      : num  39.9 39.5 39.1 38.7 38.3 ...
 $ lower     : num  28 28.3 27.3 25 22 ...
 $ upper     : num  51.7 50.6 50.9 52.4 54.6 ...
snipped

library(rgl)
open3d()
with(pred, surface3d(unique(rating),unique(complaints),yhat,alpha=.2))
with(att, points3d(rating,complaints,privileges, col="red"))
title3d(xlab="rating",ylab="complaints",zlab="privileges")
axes3d()
aspect3d(x=1,z=.05)
一旦你意识到在该模型的不适当外推极端值上没有数据,你就能很好地说明外推的危险。rms包拥有一个perimeter函数,而绘图函数则有一个perim参数,可以将周长对象传递给它。