函数
scipy.signal.find_peaks 的作用是查找峰值,但是理解其参数
width、
threshold、
distance 和最重要的
prominence 对于获得良好的峰值提取非常重要。
根据我的测试和文档,
prominence 的概念是“有用概念”,可保留好峰值并丢弃噪声峰值。
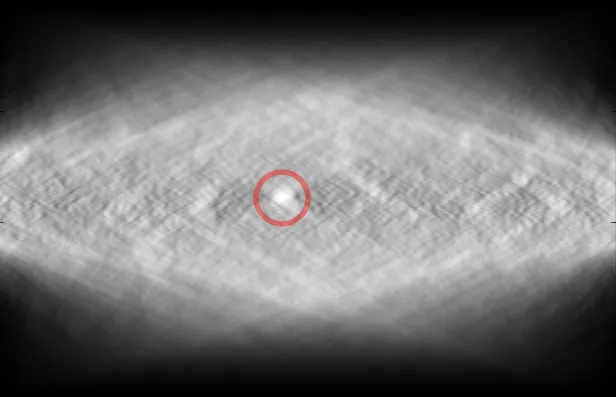
什么是
(地形)突出度?它是“从山顶下降到任何更高地形所需的最小高度”,如下图所示:
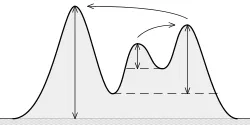
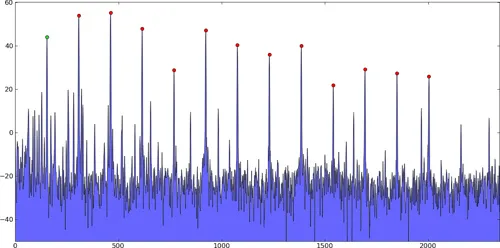
思路是:
突出度越高,峰值就越“重要”。
测试结果如下图所示:
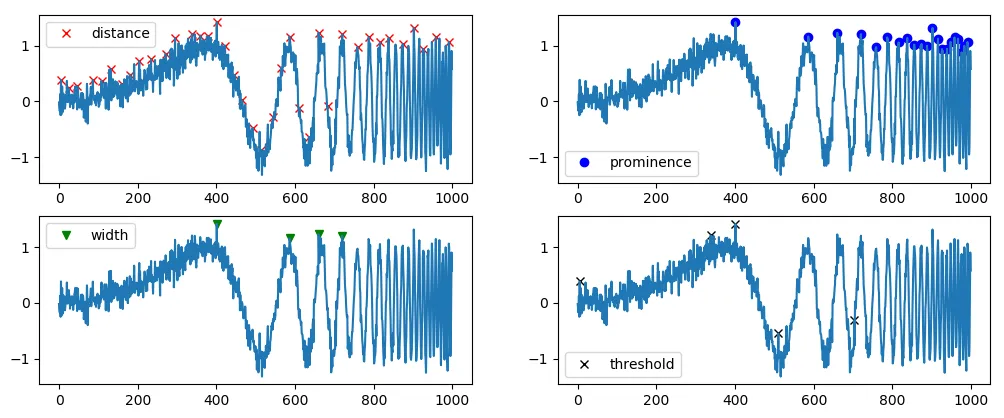
我故意使用了一个(嘈杂的)频率变化正弦波,因为它显示了许多困难。 我们可以看到,在此处设置最小
width 太高时,
width 参数并不是非常有用,因为它将无法跟踪高频部分中非常接近的峰值。如果将
width 设置太低,则在信号左侧会有许多不需要的峰值。
distance 也存在相同的问题。
threshold 仅与直接邻居进行比较,这在这里并不有用。
prominence 是提供最佳解决方案的函数。请注意,您可以组合使用许多这些参数!
代码:
import numpy as np
import matplotlib.pyplot as plt
from scipy.signal import find_peaks
x = np.sin(2*np.pi*(2**np.linspace(2,10,1000))*np.arange(1000)/48000) + np.random.normal(0, 1, 1000) * 0.15
peaks, _ = find_peaks(x, distance=20)
peaks2, _ = find_peaks(x, prominence=1)
peaks3, _ = find_peaks(x, width=20)
peaks4, _ = find_peaks(x, threshold=0.4)
plt.subplot(2, 2, 1)
plt.plot(peaks, x[peaks], "xr"); plt.plot(x); plt.legend(['distance'])
plt.subplot(2, 2, 2)
plt.plot(peaks2, x[peaks2], "ob"); plt.plot(x); plt.legend(['prominence'])
plt.subplot(2, 2, 3)
plt.plot(peaks3, x[peaks3], "vg"); plt.plot(x); plt.legend(['width'])
plt.subplot(2, 2, 4)
plt.plot(peaks4, x[peaks4], "xk"); plt.plot(x); plt.legend(['threshold'])
plt.show()