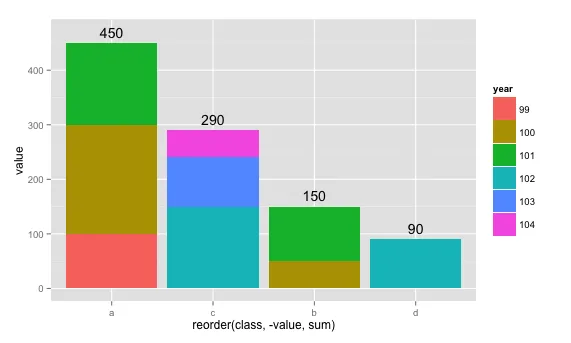
如何在ggplot2中绘制每个类的总和值(在我的情况下:a=450,b=150,c=290,d=90)在堆叠条形图上方?这是我的代码:
#Data
hp=read.csv(textConnection(
"class,year,amount
a,99,100
a,100,200
a,101,150
b,100,50
b,101,100
c,102,70
c,102,80
c,103,90
c,104,50
d,102,90"))
hp$year=as.factor(hp$year)

#Plotting
p=ggplot(data=hp)
p+geom_bar(binwidth=0.5,stat="identity")+
aes(x=reorder(class,-value,sum),y=value,label=value,fill=year)+
theme()
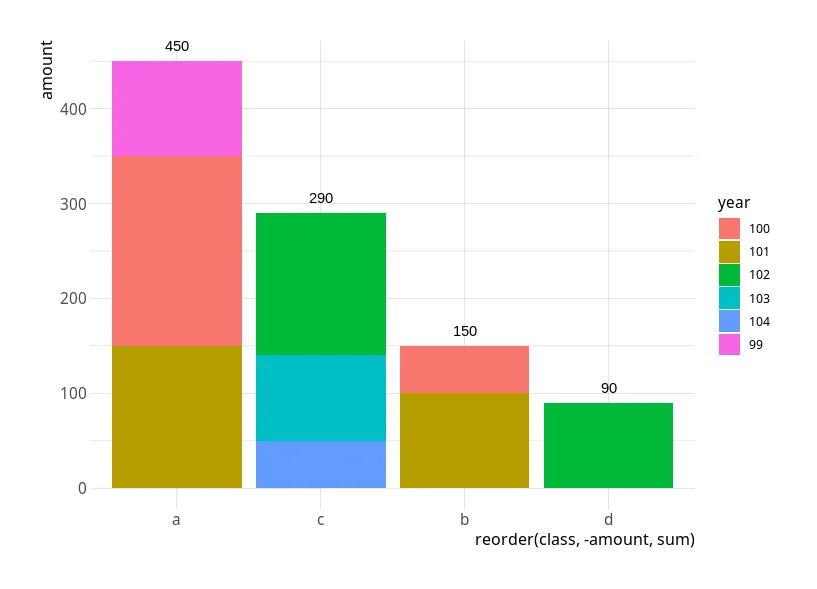
aes调用应该是:aes(x=reorder(class,-amount,sum),y=amount,label=amount,fill=year)+- Keith Hughitt