R iGraph中的顶点热图

4

我对R还比较陌生,碰到了一个问题。 
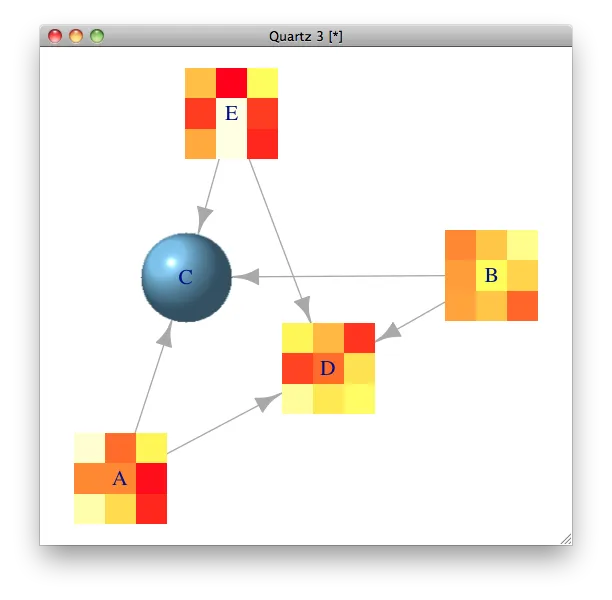
在iGraph中是否可能在节点上打印热图? 我知道可以用彩色正方形或圆形来表示,但是否可能打印小的热图呢? 下面是绘制当前图形的代码:

    # create graph
graph <- graph.data.frame(network[,1:2])
vertex_names <- get.vertex.attribute(graph,"name")


# define node attributes
V(graph)$label.font <- 1
V(graph)$label.font[which(element_types[vertex_names,"type"]=="PRIMARIES")] <- 2
V(graph)$label.font[which(element_types[vertex_names,"type"]=="REACTION")] <- 2

V(graph)$label <- element_types[vertex_names,"label"]
V(graph)$color <- element_types[vertex_names,"color"]
V(graph)$size <- as.integer(element_types[vertex_names,"size"]*20)
V(graph)$label.cex <- element_types[vertex_names,"weight"]

V(graph)$frame.color <- "gray"
V(graph)$frame.color[which(element_types[vertex_names,"type"]=="PRIMARIES")] <- "white"
V(graph)$frame.color[which(element_types[vertex_names,"type"]=="PATHWAY")] <- "white"
V(graph)$frame.color[which(element_types[vertex_names,"type"]=="PRODUCTS")] <- "white"
V(graph)$frame.width <- 10

V(graph)$shape <- "square"
V(graph)$shape[which(element_types[vertex_names,"type"]=="REACTION")] <- "circle"

V(graph)$label.color <- "black"
V(graph)$label.color[which(element_types[vertex_names,"type"]=="PRIMARIES")] <- "darkred"
V(graph)$label.color[which(element_types[vertex_names,"type"]=="PATHWAY")] <- "darkgreen"
V(graph)$label.color[which(element_types[vertex_names,"type"]=="REACTION")] <- "darkorange3"

E(graph)$color <- "red"
E(graph)$color[which(network[,3]=="out")] <- "blue"
E(graph)$color[which(network[,3]=="external")] <- "darkgreen"
E(graph)$arrow.size <- 0.5

layout <- layout.auto(graph)
plot.igraph(graph,layout=layout,main=pathways[pathway_id,"COMMON-NAME"])

此外,我有一个矩阵列表,可以绘制成热力图。这些矩阵的外观如下:
[[1]]
     TotalSNP HighSNP ModerateSNP PromotorSNP
[1,]        1       0           0           1
[2,]        3       0           2           1
[3,]        5       0           2           3
[4,]        1       0           0           1
[5,]        7       0           4           3
[6,]        3       0           3           0
[7,]        4       0           1           3
[8,]        3       0           2           1

[[2]]
     TotalSNP HighSNP ModerateSNP PromotorSNP
[1,]        3       0           1           2
[2,]        0       0           0           0

[[3]]
     TotalSNP HighSNP ModerateSNP PromotorSNP
[1,]        0       0           0           0
[2,]        0       0           0           0

请问是否可以将这些矩阵绘制成顶点的热图?

示例数据:

    FinalList <- list(structure(c(1, 3, 5, 1, 7, 3, 4, 3, 0, 0, 0, 0, 0, 0, 0, 
0, 0, 2, 2, 0, 4, 3, 1, 2, 1, 1, 3, 1, 3, 0, 3, 1), .Dim = c(8L, 
4L), .Dimnames = list(NULL, c("TotalSNP", "HighSNP", "ModerateSNP", 
"PromotorSNP"))), structure(c(3, 0, 0, 0, 1, 0, 2, 0), .Dim = c(2L, 
4L), .Dimnames = list(NULL, c("TotalSNP", "HighSNP", "ModerateSNP", 
"PromotorSNP"))), structure(c(0, 0, 0, 0, 0, 0, 0, 0), .Dim = c(2L, 
4L), .Dimnames = list(NULL, c("TotalSNP", "HighSNP", "ModerateSNP", 
"PromotorSNP"))))

矩阵的大小可能会有所不同,始终为4列,但行数可以从0行到10行不等。


1
使用版本0.6.4中的新顶点形状API实际上相对容易(官方尚未发布,但R软件包已经在CRAN上)。如果您能够使您的示例可重现,那么我在这里提供帮助将更加容易,而且我不需要自己编写一些示例数据。 - Gabor Csardi
在这最后一步之前有很多数据处理,使其可重复性相当困难,但并不是非常必要。这只是另一个 graph <- graph.data.frame(network[,1:2]) 版本0.6.4中的顶点形状是否包含在此函数中?我还没有找到它。 - Henkes
1
我不太关心数据处理,你可以使用 dput()textConnection() 包含玩具数据,参见 https://dev59.com/eG025IYBdhLWcg3whGSx。这对你来说可能是一个小问题,但在许多情况下,需要花费5-10分钟来想出一些有意义的玩具数据,而只需1分钟来回答问题。如果你有一个包含数据的可重现的例子,你获得答案的机会将大大增加。 - Gabor Csardi
1个回答

4

正如我在上面的评论中所说,这是相对容易的新顶点形状API,尽管你需要知道一些技巧。 您可以在igraph中找到一些示例形状,这些会有所帮助。

因此,您需要定义一个函数来绘制您的顶点。 它必须具有三个参数:矩阵中的坐标,要绘制的顶点(NULL表示所有顶点),以及一个函数对象,您可以使用它来查询igraph图形参数。 如果您想更改热图的外观,请将image()更改为您喜欢的内容。

myheat <- function(coords, v=NULL, params) {
  colbar <- heat.colors(50)
  colbreaks <- seq(0, 1, length=length(colbar)+1)
  vertex.size <- 1/200 * params("vertex", "size")
  if (length(vertex.size) != 1 && !is.null(v)) {
    vertex.size <- vertex.size[v]
  }
  heat <- params("vertex", "heat")
  if (is.list(heat) && !is.null(v)) {
    heat <- heat[v]
  } else if (!is.null(v)) {
    heat <- list(heat)
  }
  mapply(coords[,1], coords[,2], vertex.size*2, heat,
         FUN=function(x, y, size, int) {
           stopifnot(is.matrix(int))
           nc <- ncol(int); nr <- nrow(int)
           xc <- seq(x, x+size/nc*(nc-1), length=nc)-size/nc*(nc-1)/2
           yc <- seq(y, y+size/nr*(nr-1), length=nr)-size/nr*(nr-1)/2
           image(xc, yc, int, add=TRUE, col=colbar, breaks=colbreaks)
         })
}

# OK, we add the new shape now, it will be called "heat", 
# and will have an extra vertex parameter, also called "heat". 
# This parameter gives the heatmap intensities. The shape will 
# clip as a square, ie. the edges will be cut at the boundary 
# of the heatmap.

add.vertex.shape("heat", clip=vertex.shapes("square")$clip, plot=myheat,
                 parameters=list(vertex.heat=matrix(0,3,3)))

# Some example data and random heatmaps

g <- graph.formula(A:B -+ C:D +- E)
randheat <- function() matrix(runif(9), 3)
heats <- lapply(1:vcount(g), function(x) randheat())

# Plot them

plot(g, vertex.shape="heat", vertex.heat=heats, vertex.size=50)

# You can mix various vertex shapes

par(mar=c(0,0,0,0)+.1)
plot(g, vertex.shape=c("heat", "heat", "sphere", "heat", "heat"),
     vertex.heat=heats, vertex.size=50)

plot


哈哈,这对iGraph的开发者来说可能很容易嘛!:P 非常感谢你详细的解决方案! 我会尝试将这个集成到我的代码中的! - Henkes
抱歉再次打扰您,使用您的randheat函数,该函数完美运行。然而,我的数据矩阵大小不是标准的。它总是有4列,但行数可能不同。同时,有可能没有任何行。 我尝试了很多修改您的函数,但未能使其正常运行。 - Henkes
这是我得到的错误信息: Error in image.default(xc, yc, int, add = TRUE, col = colbar, breaks = colbreaks) : dimensions of z are not length(x)(-1) times length(y)(-1) In addition: Warning message: In vattrs[[name]][index] <- value : number of items to replace is not a multiple of replacement length 我还用一些示例数据编辑了我的问题。 如果您能帮忙解决,那就太好了!! 谢谢。 - Henkes
1
最终我强制将我的矩阵变为x:x的维度,通过在我的数据中添加一列或一行0来实现。当它处于正方形x:x的维度时,它完美地工作(4:4、5:5等)。这确实增加了一些无用的数据,这是不好的,但这是一个解决方案。 如果有人找到一种方法来强制img()进行拉伸,或允许顶点成为矩形形状,请告诉我。 现在,我将把它标记为已解决。再次感谢Gabor Csardi! - Henkes

网页内容由stack overflow 提供, 点击上面的
可以查看英文原文,
原文链接