我将使用igraph来给顶点着色。
我有两个CSV文件answers和topology,用于构建图。
Answers:(这说明玩家K和N回答正确)
  Player Q1_I1
1      k     1
2      l     0
3      n     1
4      m     0
拓扑结构:(表示谁与谁相连的方式)
  Node.1 Node.2
1      k      l
2      l      k
3      l      m
4      m      l
5      l      n
6      n      l
7      n      k
8      k      n
我希望使用IGraph包构建图形,并根据它们的正确性以不同的颜色着色顶点。
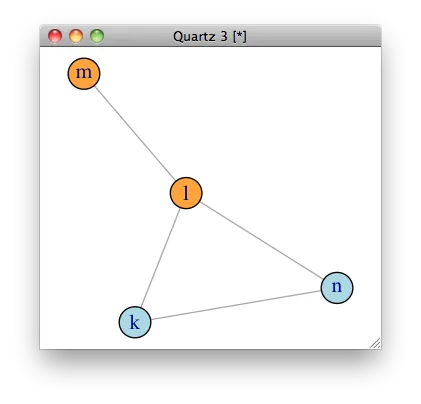
这是我所能实现的:
# reads answers and creates a graph from topology
answers <- read.csv("answers2.csv",header=T)
data<-read.csv('edges2.csv')
data<-graph.data.frame(data1, directed=FALSE)
g<-simplify(data)

# goes through vertices and colors them in different color, depending on correctness.
# 2 means second column (First one is the players name)
V(g)$color <- ifelse(answers[V(g), 2] == 1, "blue", "red")
plot(g, layout=layout.fruchterman.reingold, vertex.color=V(g)$color)
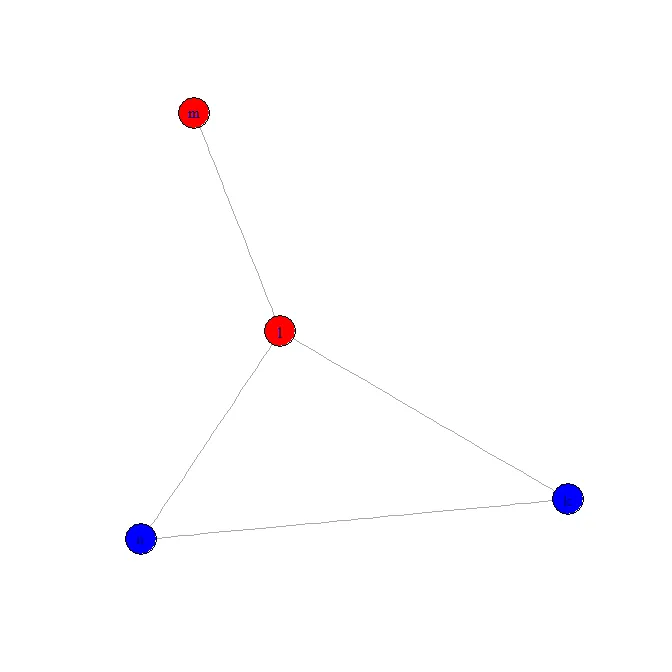
问题在于输出中的颜色是错误的:
 这里M和K被标记为正确的,但实际上应该是N和K。
我认为问题是因为我没有指定Node应该与Player相关联,尽管我试图做到这一点,但没有成功。
这里M和K被标记为正确的,但实际上应该是N和K。
我认为问题是因为我没有指定Node应该与Player相关联,尽管我试图做到这一点,但没有成功。有什么想法可以解决这个问题吗?