R Plotly: 气泡图中使用较小的标记

3

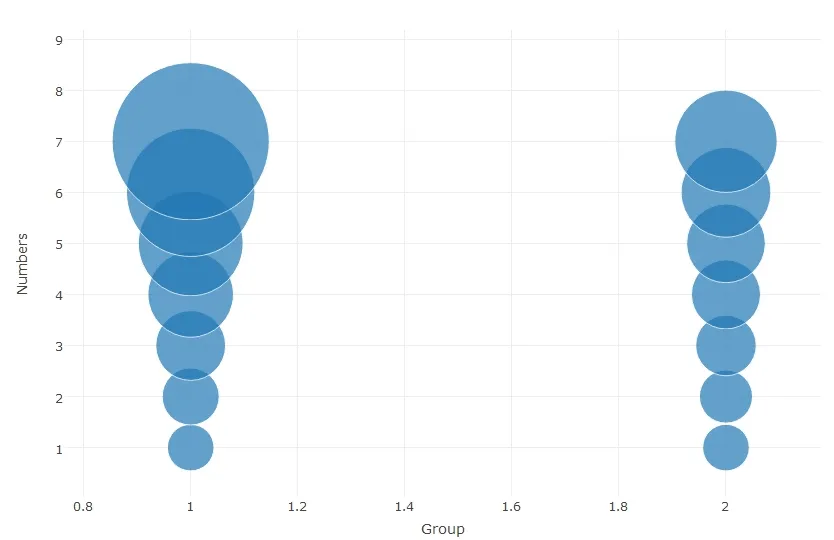
我正在使用Plotly(为R)制作气泡图,但是我一直遇到重叠的标记。是否有一种方法可以“缩小”所有标记,以便保留它们的相对大小但没有重叠?我想保持绘图的尺寸不变。以下是一个测试案例:

test <- data.frame(matrix(NA, ncol=3, nrow=14))
colnames(test) <- c("Group", "Numbers", "Days")
loop<- 1
for(i in 1:7){
    test[i,] <- c(1, i, loop)
    loop <- loop * 1.5
}
loop <- 1
for(i in 1:7){
    test[i+7,] <- c(2, i, loop)
    loop <- loop * 1.3
}
plot_ly(test, x=Group, y=Numbers, size=Days, mode="markers")

booo overlapping markers

1个回答

6

实现这种功能的一种方法是调整marker中的sizeref(和size)参数:

plot_ly(test, x=Group, y=Numbers, mode="markers",
    marker = list(size = Days, sizeref = 0.15))

plot_ly(test, x=Group, y=Numbers, mode="markers", 
    marker = list(size = Days/2, sizeref = 0.1))

plot_ly(test, x=Group, y=Numbers, size = Days, mode="markers",
    marker = list(sizeref = 2.5)) # Days data in the hoverinfo with this method

来自 https://plot.ly/r/reference/:

sizeref (数字)
默认值: 1
仅在marker.size设置为数字数组时有效。设置用于确定标记点呈现大小的比例系数。与sizeminsizemode一起使用。

如果您希望悬停文本与原始图表相匹配,可以明确定义它:

plot_ly(test, x=Group, y=Numbers, mode="markers",
    marker = list(size = Days, sizeref = 0.15),
    hoverinfo = "text", 
    text = paste0("(", Group, ", ", Numbers, ")<br>", "Days (size): ", Days))

我之前看到过sizeref,但不知道它要这样使用。非常感谢! - Kira Tebbe

网页内容由stack overflow 提供, 点击上面的
可以查看英文原文,
原文链接