我正在使用
通过以下方式,我可以制作出所需的精确地图:
ggplot2绘制(映射)sf对象。据我了解,自版本2.2.1以来,ggplot2包含用于简单要素对象的几何图形geom_sf。通过以下方式,我可以制作出所需的精确地图:
library(sf)
library(ggplot2)

# some points to start with
a <- st_as_sf(data.frame(lon = c(1,4,6), lat = c(0,0,-3)), coords = c('lon', 'lat'))
b <- st_as_sf(data.frame(lon = c(2.5,4), lat = c(-4.5,-5)), coords = c('lon', 'lat'))

# circles around those points
buf.a <- st_buffer(a, 1)
buf.b <- st_buffer(b, 1)

# colors to mark the points
sol.a = rgb(1,0,0)
sol.b = rgb(0,0,1)

# colors to fill the circles
fil.a = adjustcolor(sol.a, alpha.f = .25)
fil.b = adjustcolor(sol.b, alpha.f = .25)

# the plot I want
g = ggplot() +
    geom_sf(data = buf.a, fill =  fil.a, color = NA) +
    geom_sf(data = buf.b, fill =  fil.b, color = NA) +
    geom_sf(data = a,     color = sol.a, shape = 20, size = 3) +
    geom_sf(data = b,     color = sol.b, shape = 20, size = 3)
g
它产生
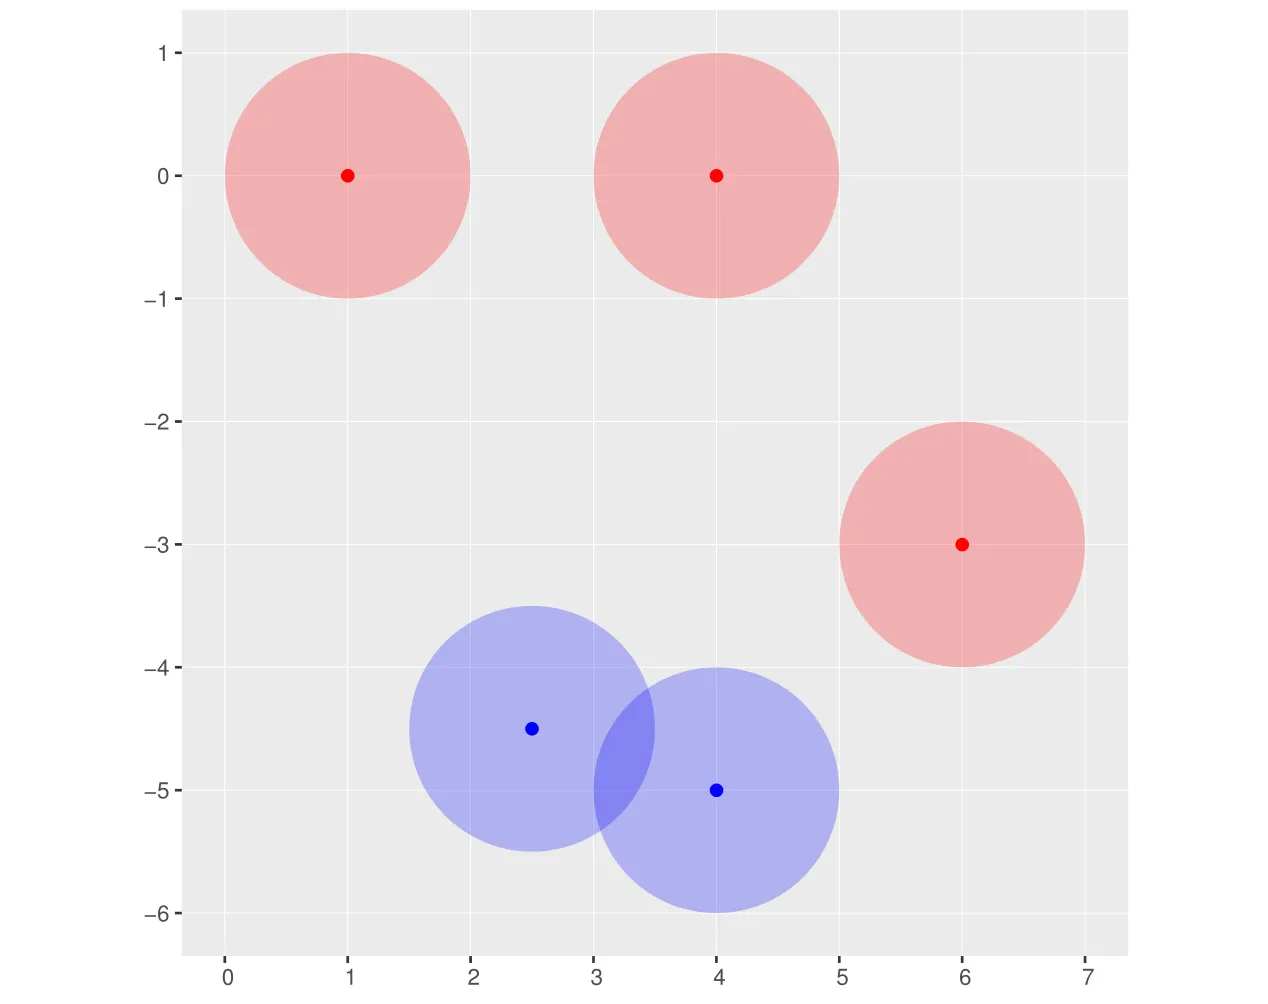
这正是我想要的,只是缺少一个图例。因此,我正在进行...
cols.fill = c("GROUP A" = fil.a, "GROUP B" = fil.b)
cols.sol = c("GROUP A" = sol.a, "GROUP B" = sol.b)

g = ggplot() +
    geom_sf(data = buf.a, color = NA, aes(fill = 'GROUP A')) +
    geom_sf(data = buf.b, color = NA, aes(fill = 'GROUP B')) +
    geom_sf(data = a,     shape = 20, size = 3, aes(color = 'GROUP A')) +
    geom_sf(data = b,     shape = 20, size = 3, aes(color = 'GROUP B')) +
    scale_fill_manual(name = "circles", values = cols.fill) +
    scale_color_manual(name = "points", values = cols.sol)
g
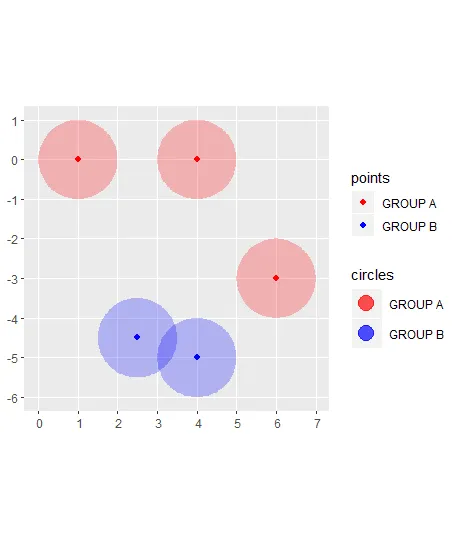
这提供了
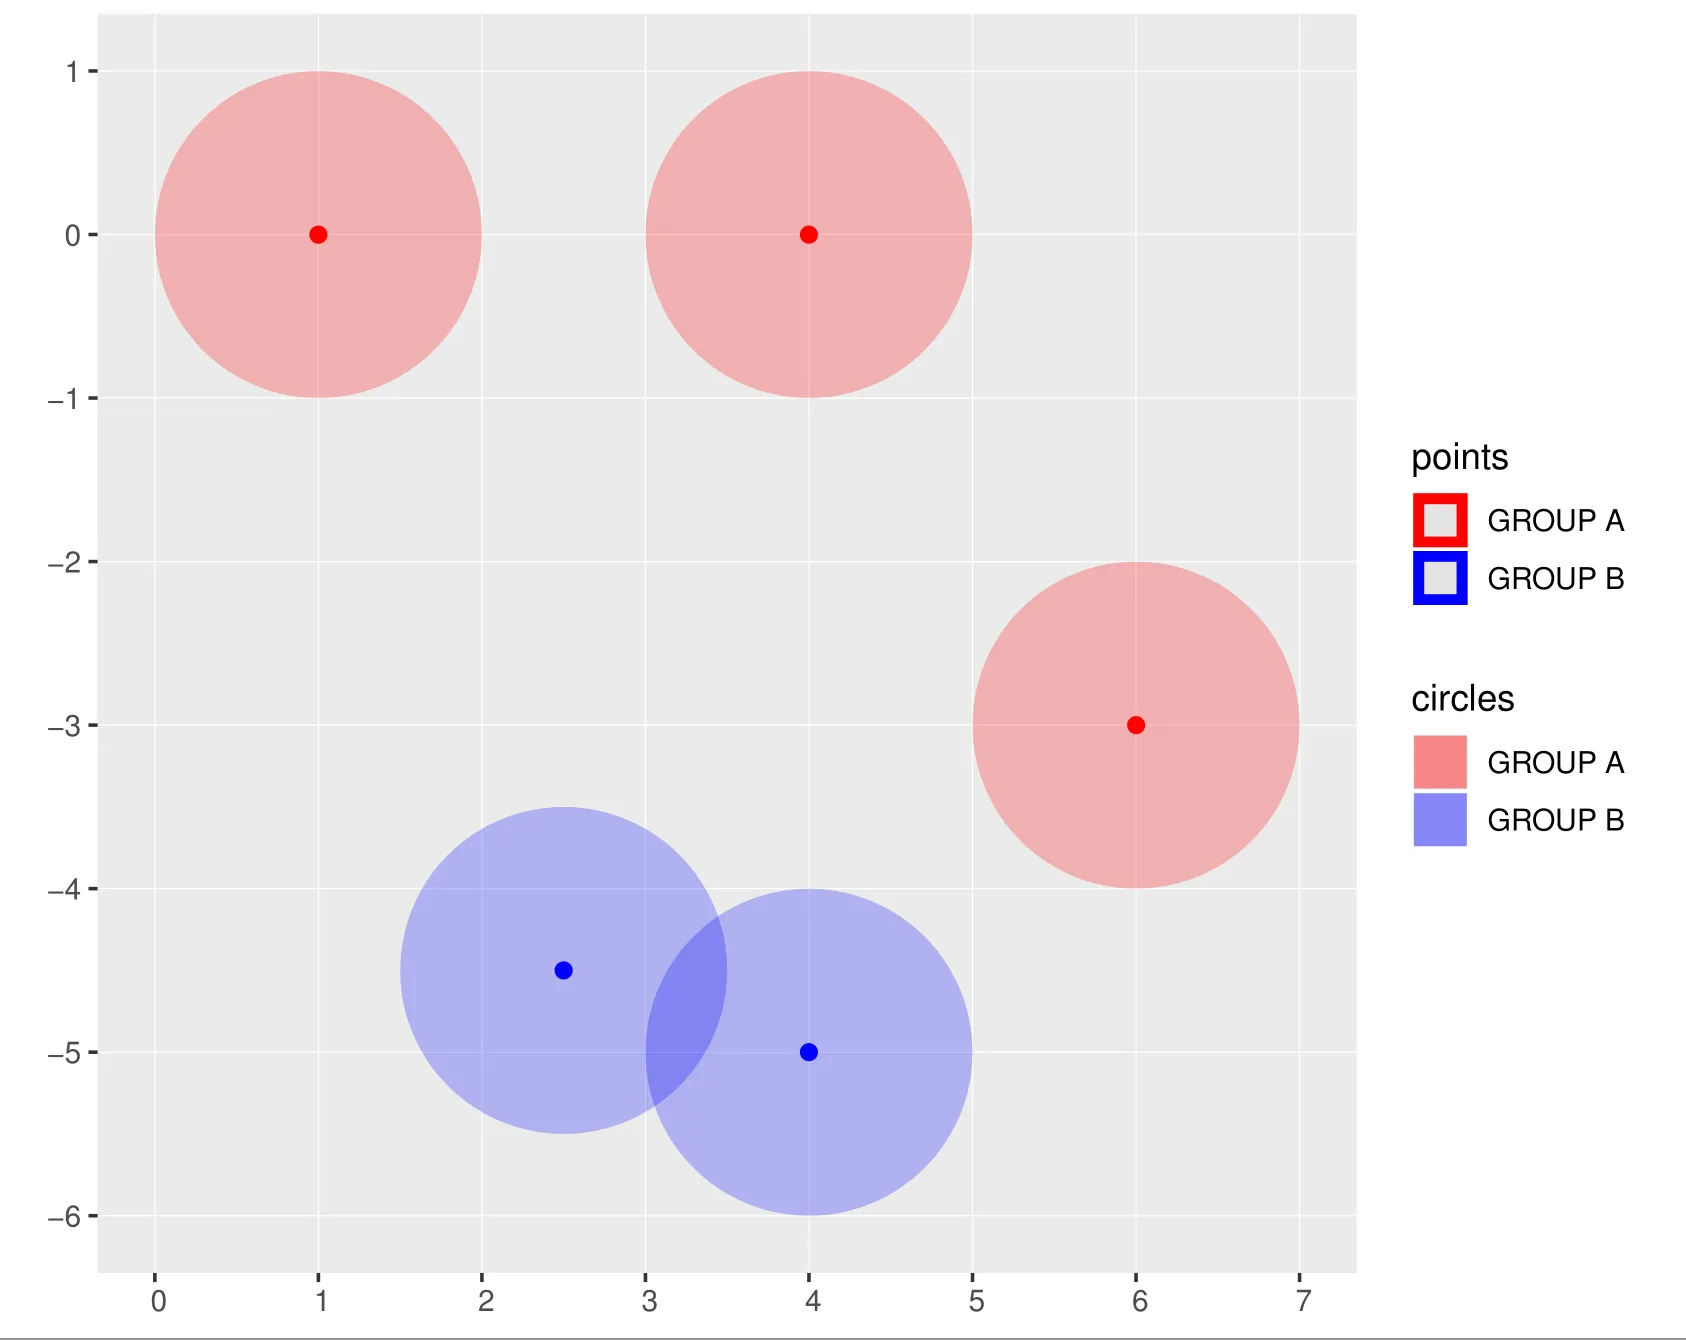
我不想要那个,因为在图例中:
- 'points' 应该是点(而不是正方形);并且
- 'circles' 应该是圆圈(同样不是正方形)
如果图例能够遵守我的颜色透明度就好了(在这个例子中已经实现了)。
我试着将上述的最后几行改成如下内容:
scale_fill_manual(name = "circles", values = cols.fill,
                  guide = guide_legend(override.aes = list(shape = c(19, 19)))) +
scale_color_manual(name = "points", values = cols.sol,
                   guide = guide_legend(override.aes = list(shape = c(20, 20))))
但这对我的情节没有任何帮助。
有什么想法吗?
注意:如果为了情节更简单,我可以改变数据的结构,例如通过将对象a和b合并到同一个简单要素对象中,并添加一列指示组(对于buf.a和buf.b也是如此)。