我正在尝试在读取数据文件后绘制曲线。曲线上方和下方的背景应该不同(比如红色和绿色)。这就像一个相图,显示一个分界线以上和以下的两个不同相。在Python中使用matplotlib是否可能?我的代码如下:
#!/usr/bin/env python

import numpy as np
import pylab as pl
import matplotlib.pyplot as plt

# Use numpy to load the data contained in the file
# 'data.txt' into a 2-D array called data
data = np.loadtxt('data.txt')
# plot the first column as x, and second column as y
x=data[:,0]
y=data[:,1]
pl.plot(x,y, '-r')
pl.xlabel('x')
pl.ylabel('y')
pl.show()
'data.txt'文件包含:
0 0
1 1
2 4
3 9
4 16
5 25
6 36
7 49
8 64
9 81
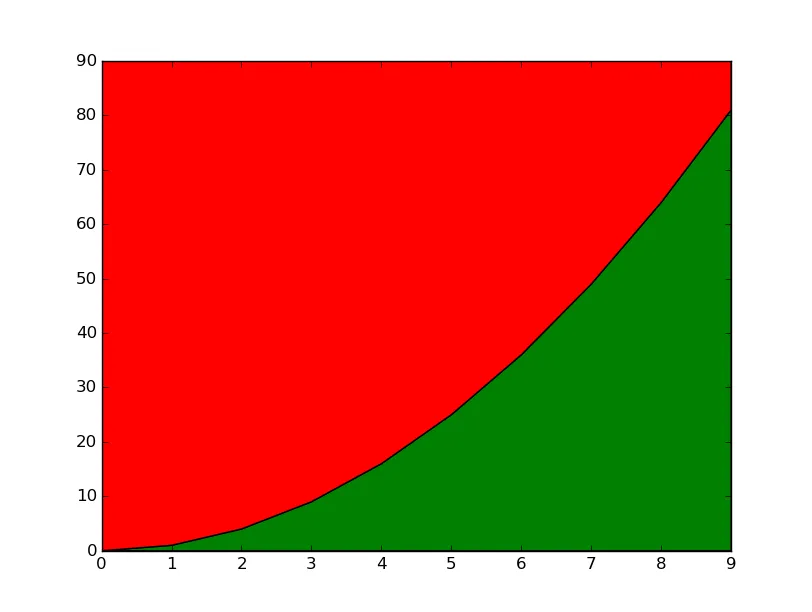
因此,它应该绘制一个抛物线。
这里有可能重复的问题。但是,在我的情况下似乎不起作用。
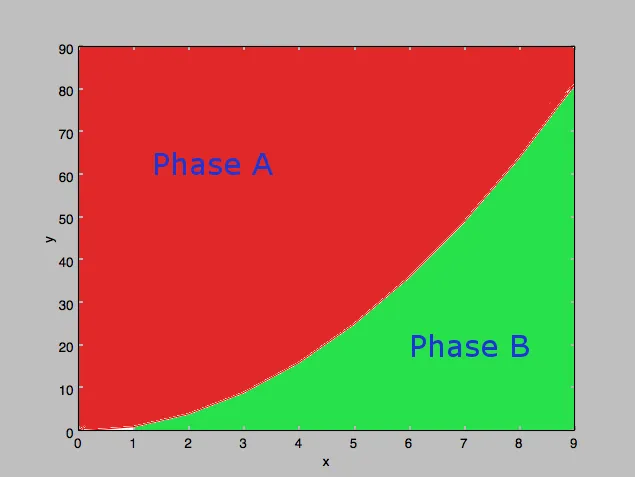
另外,我想在不同颜色的补丁中间输入文本。
因此,我的绘图应该如下所示: