如何在networkx无向图中绘制循环边

4

我有以下图表:

graph = {("A","A"): 3, ("A","B"): 4, ("A","C"): 1}

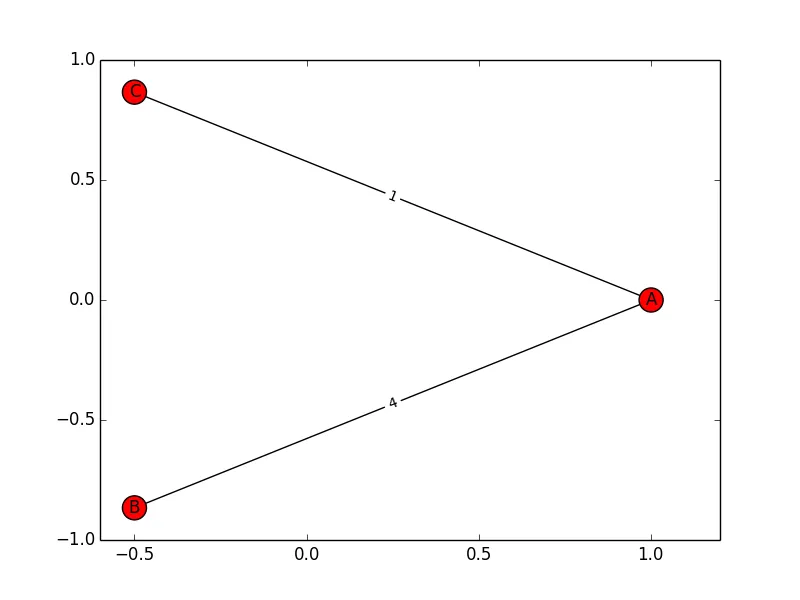
我正在尝试绘制一个标有数字3的节点(A)的循环图。该循环应该类似于节点(1) 这里 的循环。

它必须是一个无向图。

到目前为止,我正在使用以下内容:

import networkx as nx
import matplotlib.pyplot as plt

G=nx.Graph()

for edge in graph:
    G.add_edge(edge[0], edge[1])
graph_pos=nx.shell_layout(G)
nx.draw_networkx_nodes(G,graph_pos)
nx.draw_networkx_edges(G,graph_pos)
nx.draw_networkx_labels(G, graph_pos)
nx.draw_networkx_edge_labels(G, graph_pos, edge_labels = graph)

plt.show()

输出结果是:

enter image description here

如您所见,即使存在边缘(“A”,“A”),也没有节点“A”周围的循环。 有什么想法可以让它发生吗?
编辑 - 为什么不是重复?
问题Matplotlib and Networkx - drawing a self loop node 是针对定向图的。 当您使用G=nx.MultiDiGraph创建图形时,可以使用G.graph['edge']设置边缘属性。
使用nx.Graph()(无向图),G.graph['edge']的结果是一个空字典。
本问题与该问题的本质区别在于,我使用nx.Graph而该问题使用nx.MultiDiGraph

可能是Matplotlib和Networkx-绘制自环节点的重复问题。 - Mitch
请删除此评论。这是针对
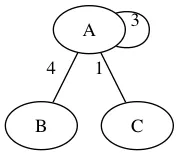
nx.MultiDiGraph的答案,意味着一个有向图。我需要一个无向图。当您创建G = nx.Graph()时,不存在G.graph['edge']这样的东西。 - regina_fallangi
2个回答

2
P.E. Normand的回答让我看了一下`graphviz`,我意识到,如果我将有向图的`arrowsize`更改为0,它看起来就像一个无向图。使用这个方法,我可以重复使用Matplotlib和Networkx-绘制自环节点中的答案,但我仍然缺少标签边。使用这里的答案,我成功创建了以下图形:
import networkx as nx
from networkx.drawing.nx_agraph import to_agraph

graph = {("A","A"): 3, ("A","B"): 4, ("A","C"): 1}
G=nx.MultiDiGraph()

# add edges
for edge in graph:
    G.add_edge(edge[0], edge[1])

# arrow size: '0' makes it look like an indirected graph
G.graph['edge'] = {'arrowsize': '0', 'splines': 'curved'}
G.graph['graph'] = {'scale': '3'}

A = to_agraph(G)
A.layout('dot')

# set edge labels
for pair in graph:
    edge = A.get_edge(pair[0], pair[1])
    edge.attr['label'] = str(graph[pair]) + "  "

A.draw('test.png')

这是图表:

enter image description here

这个答案可能是有向图问题的重复,但我仍然认为对于无向图进行小调整是值得的。

1
据我所知,networkx的绘图函数没有为自环做出任何努力。这让我说出这样的话来的原因是:如果你将脚本更改为:
    import networkx as nx
import matplotlib.pyplot as plt

G=nx.Graph()
graph = {("A","A"): 3, ("A","B"): 4, ("A","C"): 1}
#graph = {("A","B"): 4, ("A","C"): 1}
for edge in graph:
    G.add_edge(edge[0], edge[1])
graph_pos=nx.circular_layout(G)
nx.draw_networkx_edge_labels(G, graph_pos, edge_labels = graph)
nx.draw_networkx_nodes(G,graph_pos, alpha=0.1)
nx.draw_networkx_edges(G,graph_pos)
#nx.draw_networkx_labels(G, graph_pos)


plt.show()

enter image description here

你会注意到边缘标签被显示出来。在Networkx中,边缘似乎只是顶点之间的线条。同一点之间的线条就是...什么也没有...所以我认为你在networkx中不会有好运气。然而,如Matplotlib和Networkx-绘制自循环节点所建议的那样,使用pygraphviz是你最好的选择。据我所知,graphviz(警告:它只有32位)(以及它的Python包装器pygraphviz,需要graphviz)仍然是一个非常好的图形可视化工具。安装后,你可以使用networkx.drawing.nx_agraph的to_agraph函数。祝你好运。

网页内容由stack overflow 提供, 点击上面的
可以查看英文原文,
原文链接