我有一个5个节点的有向网络,我想使用
我注意到,当我绘制所有节点之间的边缘时,如果我没有指定
以下是我的代码,其中有注释标注了问题部分:
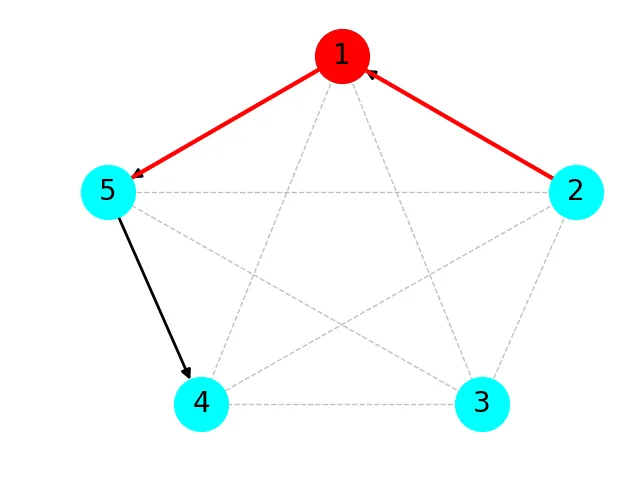
networkx以图形方式表示。节点应该以以下方式连接:
- 每个节点都用虚线连接到彼此
- 活动连接从文件中读取,并由实心黑色箭头表示
- 与运行代码的节点(在本例中为节点1)之间的活动连接应为红色。
arrow=True,箭头也不会显示出来。它似乎忽略了我在edge_color之后指定的每个选项。我注意到,当我绘制所有节点之间的边缘时,如果我没有指定
arrows=False,它就会忽略style='dashed',alpha=0.5,并只绘制灰色实线。这是否与问题有关?以下是我的代码,其中有注释标注了问题部分:
import networkx as nx
import matplotlib.pyplot as plt

class Graph(nx.DiGraph):
    def __init__(self, *args, **kwargs):
        self.nodeNum = 1
        self.pos = {'1': (0, 10),
                    '2': (10, 3),
                    '3': (6, -8),
                    '4': (-6, -8),
                    '5': (-10, 3)}
        self.allConns = []
        for i in range(5):
            for j in range(i, 5):
                self.allConns.append((str(i+1), str(j+1)))
        super().__init__(*args, **kwargs)

    def read_connections(self):
        filename = 'PATH/TO/FILE'
        with open(filename) as f:
            self.connList = []
            self.nodeConns = []
            for line in f:
                if line[-2] == '1':
                    self.connList.append((str(line[0]), str(line[1])))
                    if line[0] == self.nodeNum or line[1] == self.nodeNum:
                        self.nodeConns.append((str(line[0]), str(line[1])))
                    else:
                        pass
                else:
                    pass

    def generate_graph(self):
        self.read_connections()
        self.add_nodes_from(self.pos.keys())
        self.add_edges_from(self.connList)


    def draw_graph(self, fig=None, ax=None, show=False):
        if fig == None:
            fig = plt.figure()
        if ax == None:
            ax = fig.add_subplot(111)
        ax.axis('off')
        options = {'node_color': 'cyan',
                   'node_size': 1500,
                   'width': 2,
                   'arrowstyle': '-|>',
                   'arrowsize': 14,
                   'font_size': 20
                   }

        # This works, but if I do not specify arrows=False it draws solid lines with no transparency
        nx.draw_networkx_edges(self, self.pos, ax=ax, edgelist=self.allConns, edge_color='grey',
                               style='dashed', alpha=0.5, arrows=False)

        # This is the main part which works. It connects the nodes from the file with black arrows
        nx.draw_networkx(self, self.pos, arrows=True, ax=ax, **options)

        # This is the part that gives me problems. It seems to ignore every option after edge_color
        nx.draw_networkx_edges(self, self.pos, ax=ax, edgelist=self.nodeConns, edge_color='r',
                               style='solid',alpha=1,
                               arrows=True, width=3, arrowsize=14, arrowstyle='-|>')
        nx.draw_networkx_nodes(self, self.pos, ax=ax, nodelist=[self.nodeNum], node_color='r',
                               node_size=1500)

        fig.tight_layout()
        if show == True:
            fig.show()

if __name__ == '__main__':
    graph = Graph()
    graph.generate_graph()
    graph.draw_graph(show=True)
这是一个结果的示例。请注意,红色边缘没有箭头。