在多边形区域内绘制ggplot2/gis图表

4
为了方便复制,请参考以下数据:

library(rgdal)
library(ggplot2)
library(rgeos)

download.file("http://spatialanalysis.co.uk/wp-content/uploads/2010/09/London_Sport.zip", 

destfile = "London_Sport.zip")
unzip("London_Sport.zip")

projection="+proj=merc"

london_shape = readOGR("./", layer="london_sport")

# Create random points
set.seed(1)
points = data.frame(long=rnorm(10000, mean=-0.1, sd=0.1), lat=rnorm(10000, mean=51.5, sd=0.1))
points = SpatialPoints(points, proj4string=CRS("+proj=latlon"))

# Transform data to our projection
london = spTransform(london_shape, CRS(projection))
points = spTransform(points, CRS(projection))

# Keeps only points inside London
intersection = gIntersects(points, london, byid = T)
outside = apply(intersection == FALSE, MARGIN = 2, all)
points = points[which(!outside), ]

# Blank theme
new_theme_empty <- theme_bw()
new_theme_empty$line <- element_blank()
new_theme_empty$rect <- element_blank()
new_theme_empty$strip.text <- element_blank()
new_theme_empty$axis.text <- element_blank()
new_theme_empty$plot.title <- element_blank()
new_theme_empty$axis.title <- element_blank()
new_theme_empty$plot.margin <- structure(c(0, 0, -1, -1), unit = "lines", valid.unit = 3L, class = "unit")

# Prepare data to ggplot
london = fortify(london)
points = as.data.frame(points)

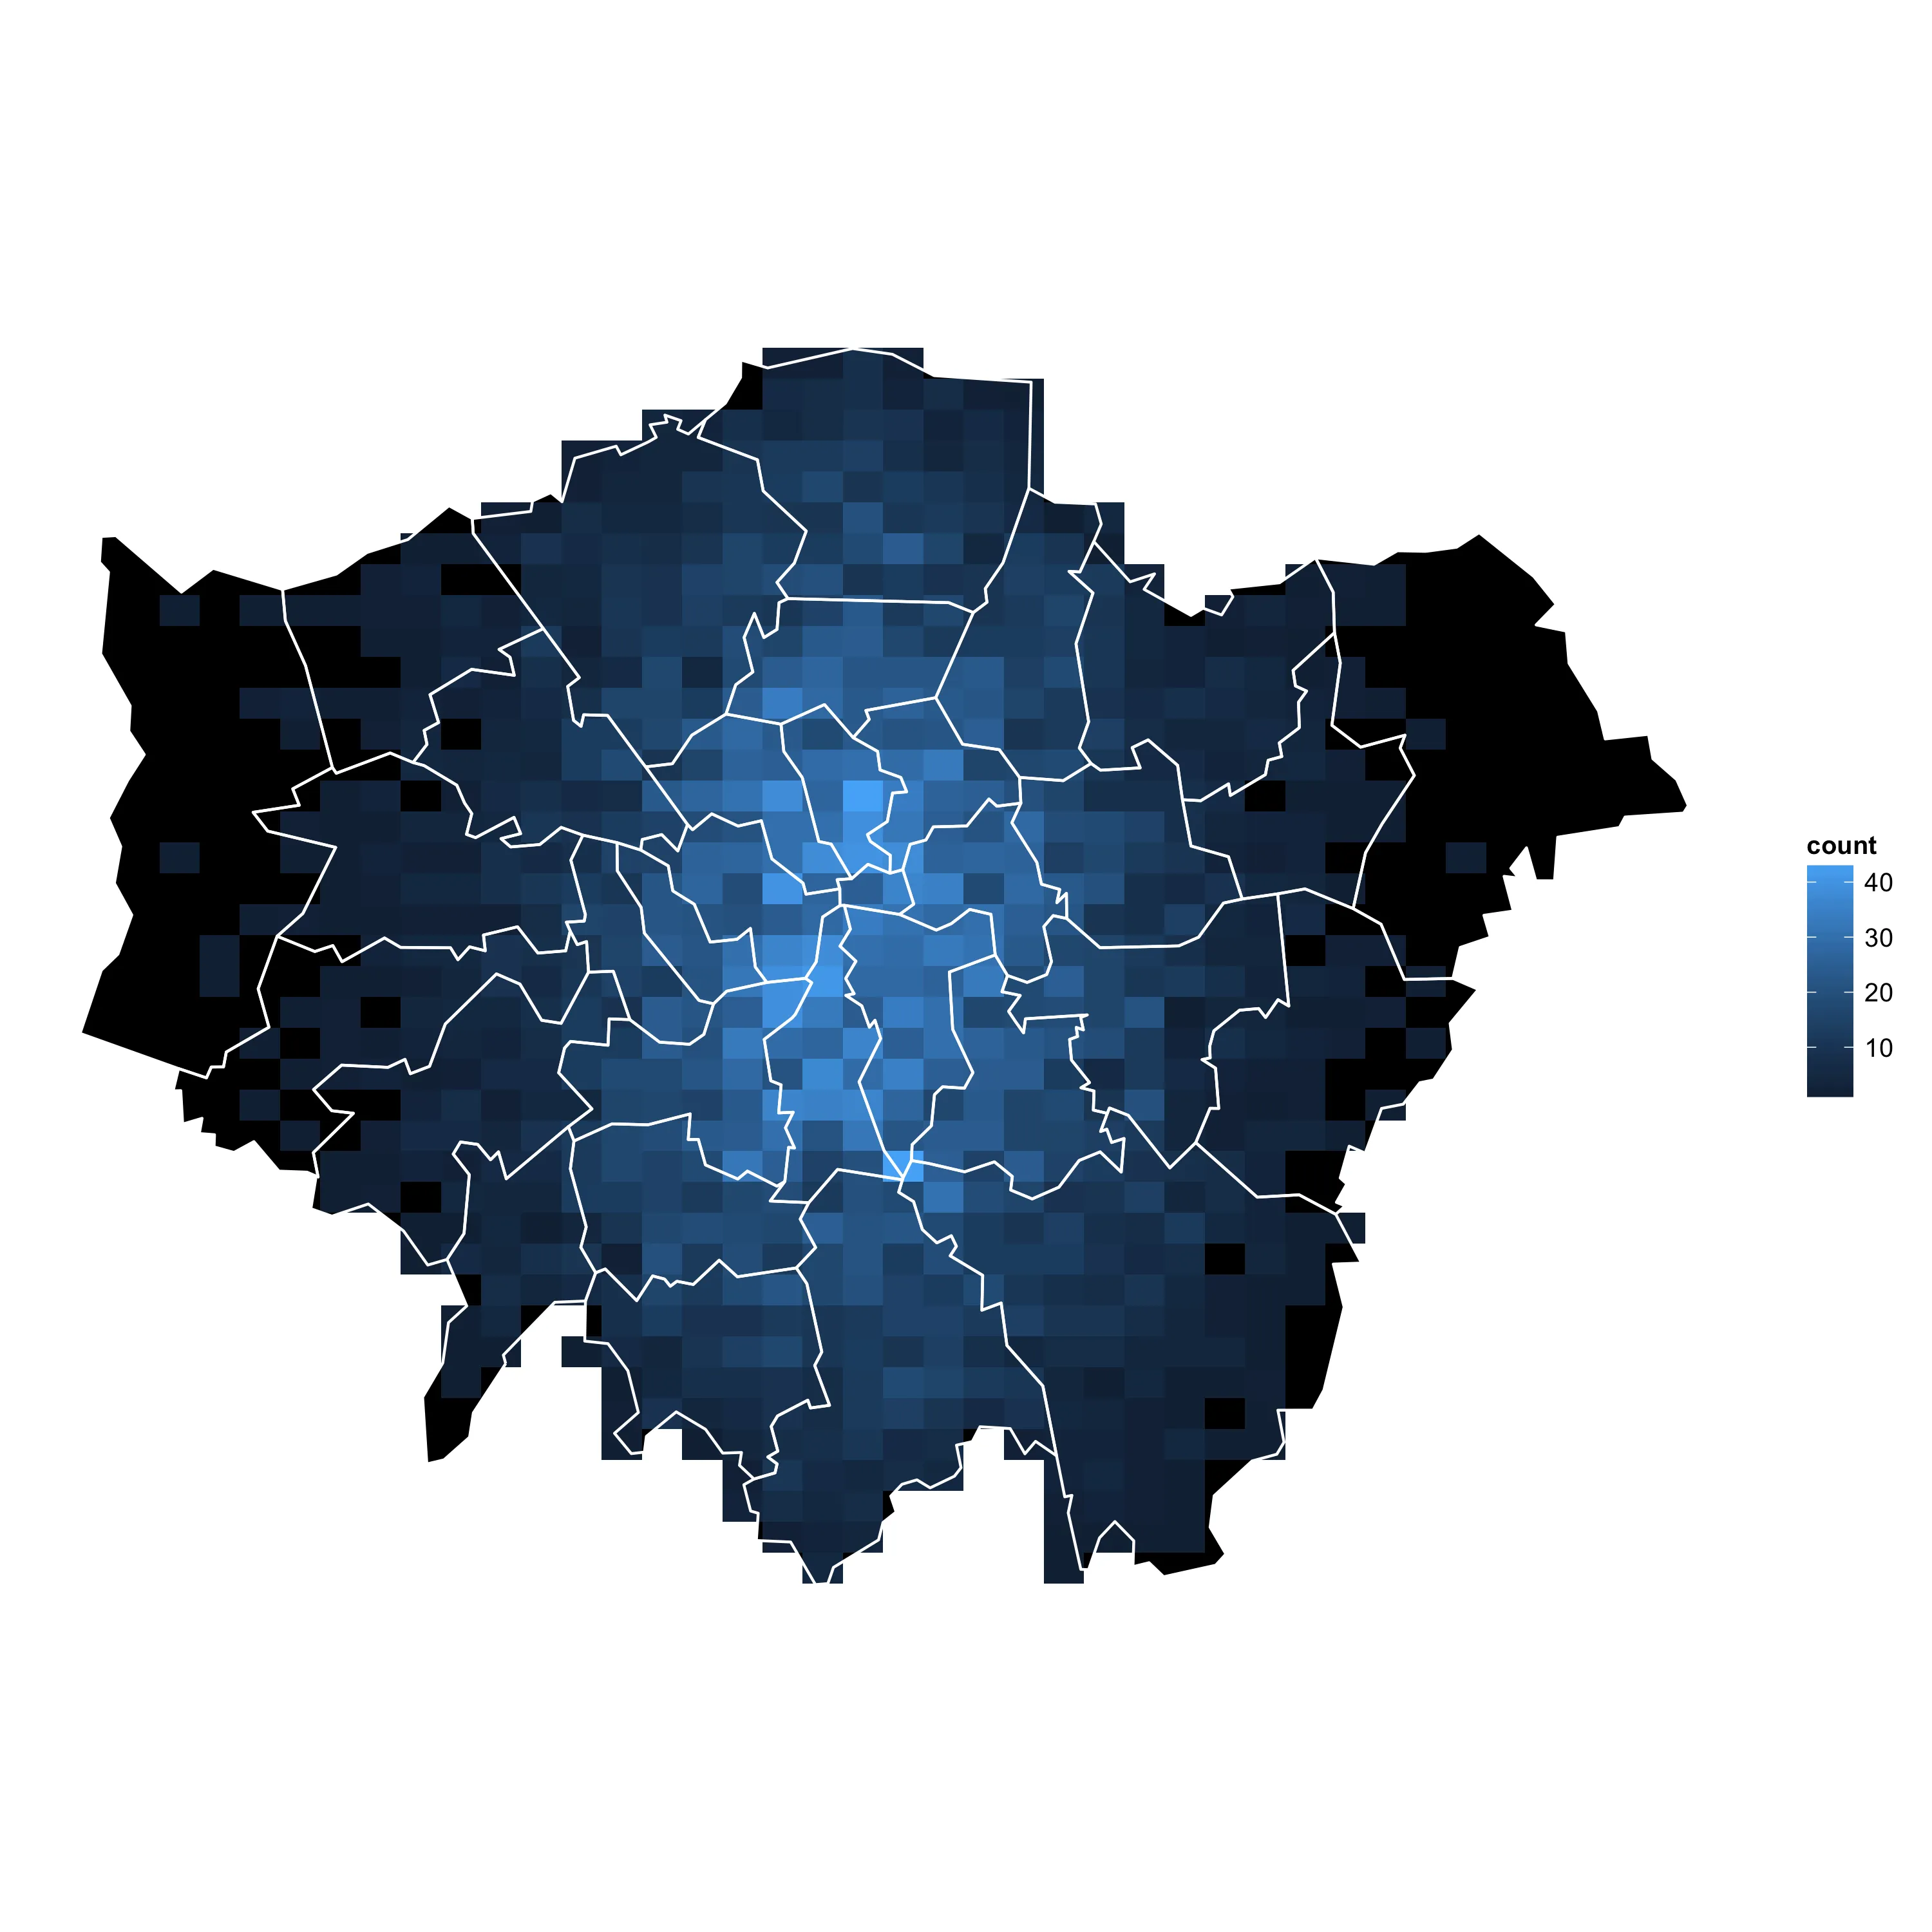
我希望绘制一个点密度图。这可以通过使用stat_bin2d来实现:

ggplot() + 
  geom_polygon(data=london, aes(x=long,y=lat,group=group), fill="black") +
  stat_bin2d(data=points, aes(x=long,y=lat), bins=40) +
  geom_path(data=london, aes(x=long,y=lat,group=id), colour='white') +
  coord_equal() +
  new_theme_empty

但是这样会导致一些密度方块被绘制在伦敦之外:
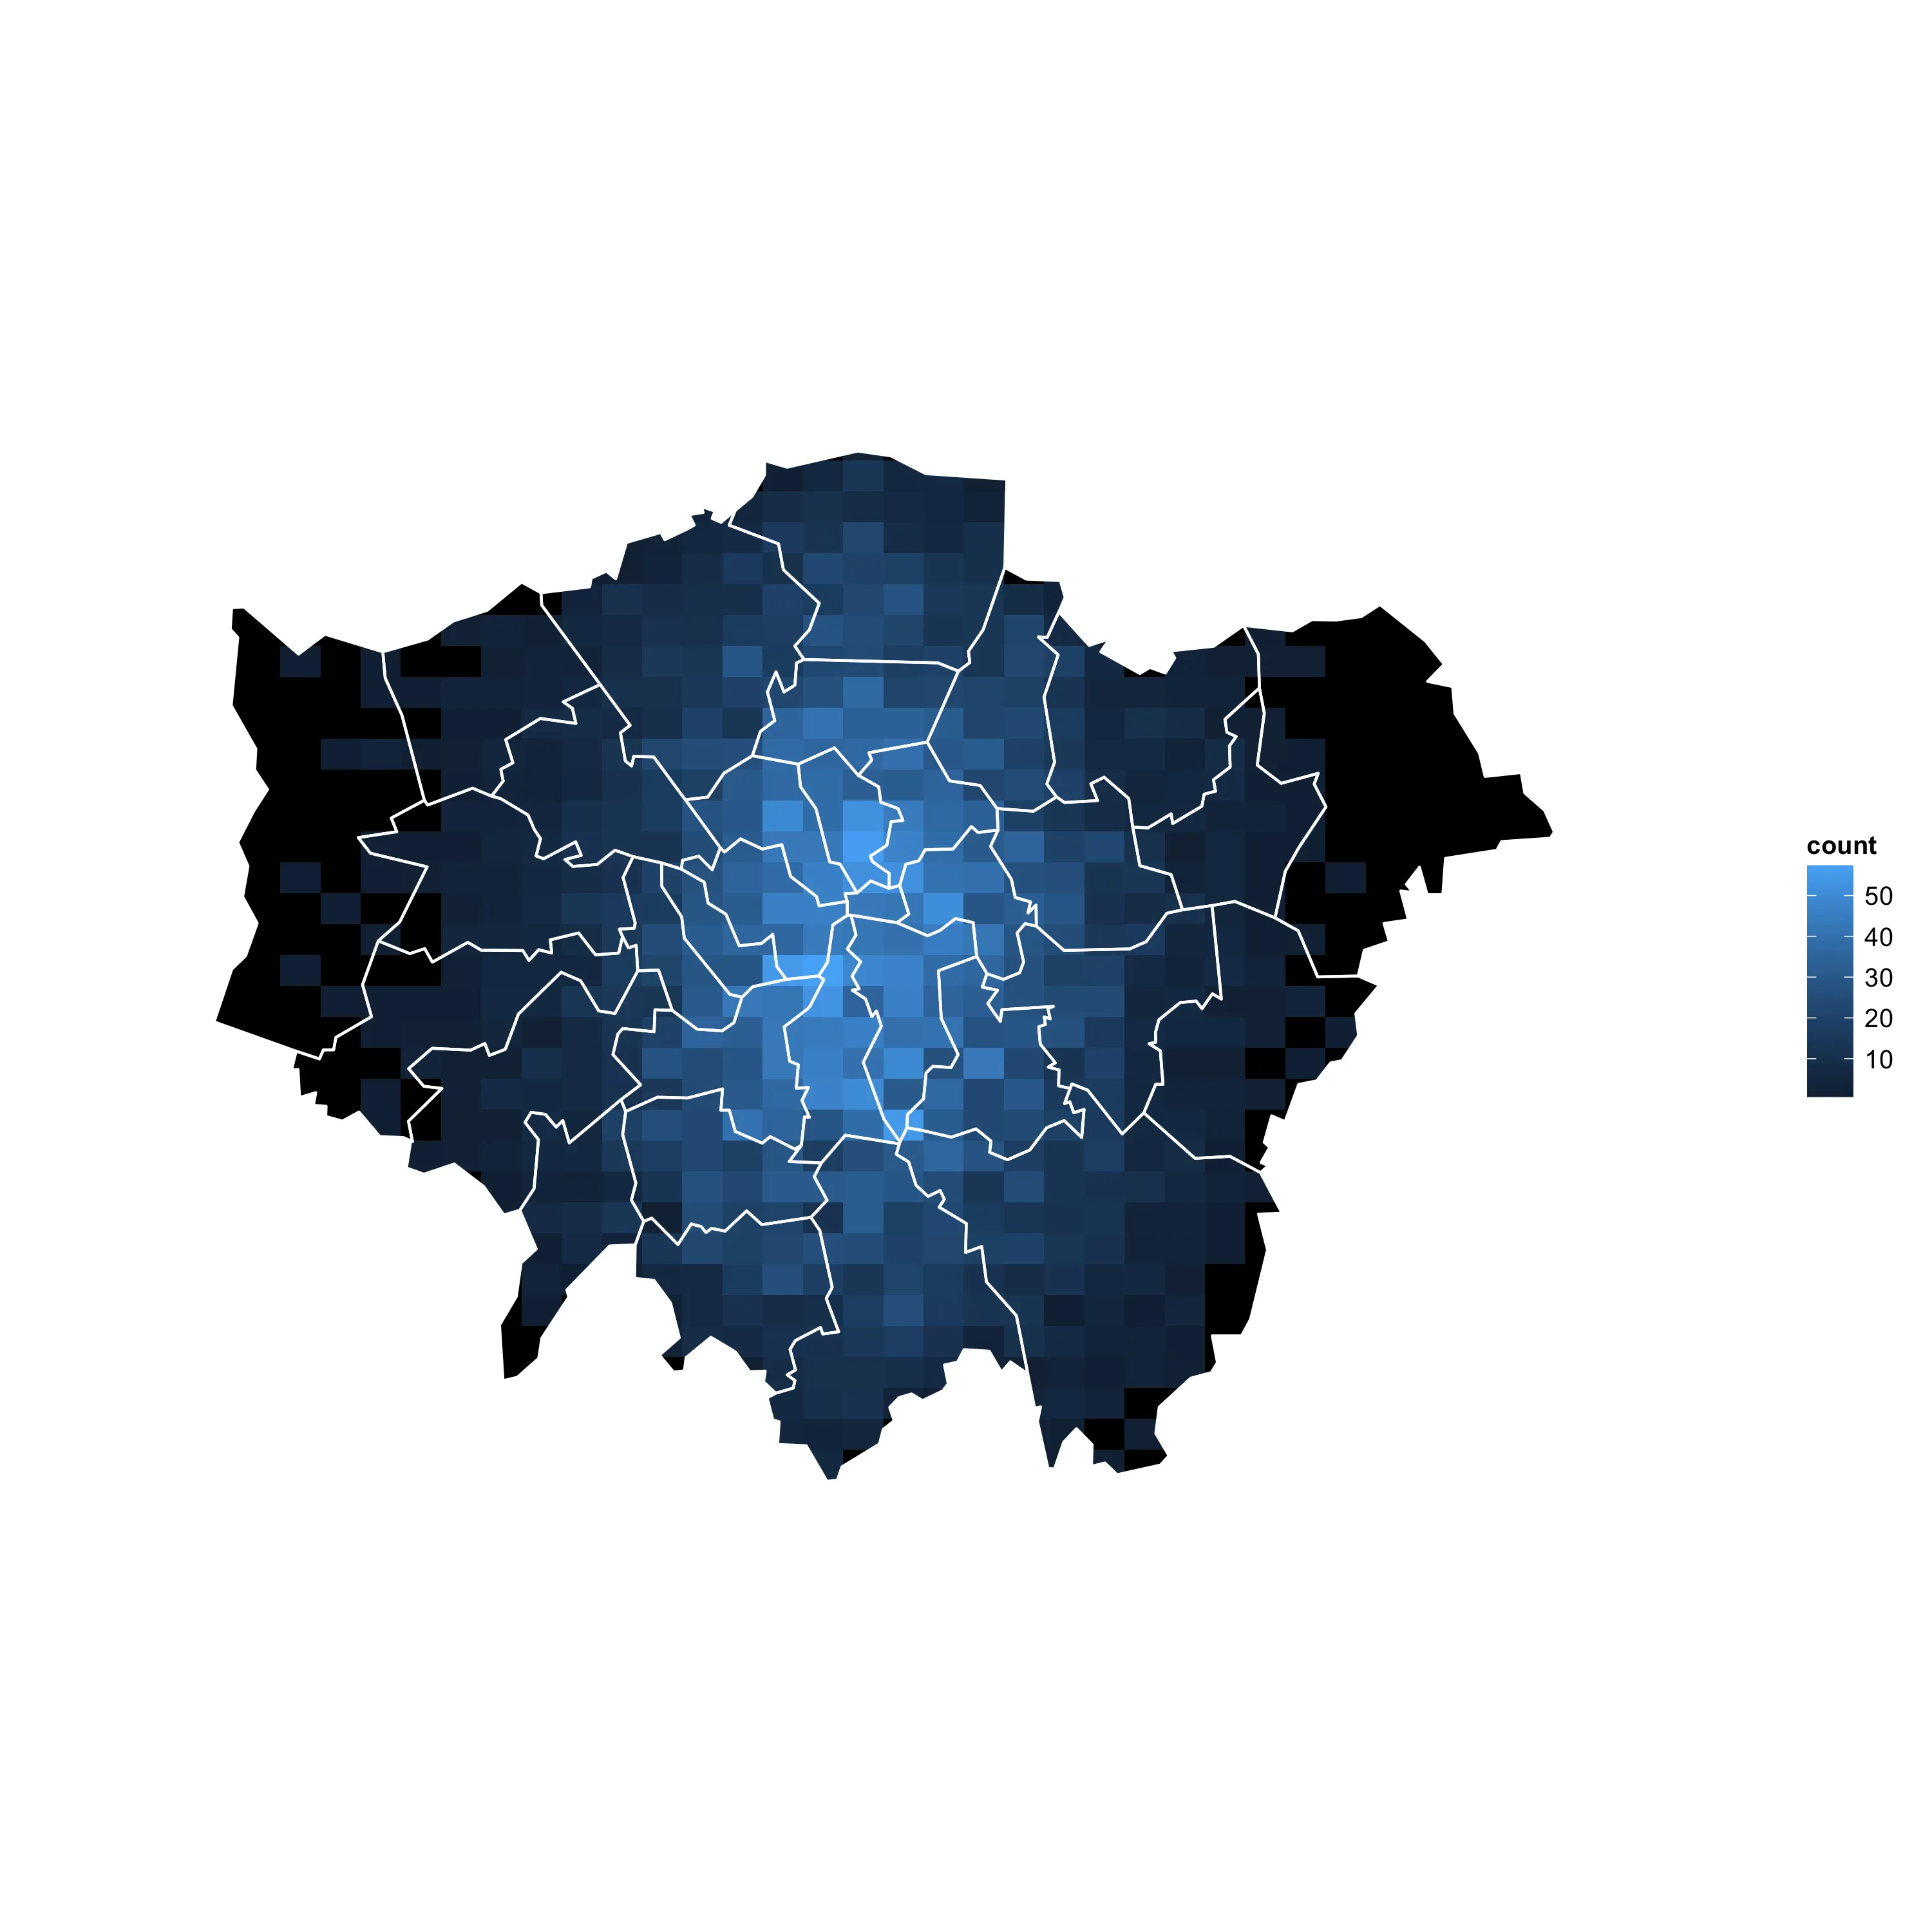
密度

我该如何仅绘制伦敦内的密度地图?

1
如果您要绘制的所有内容已经在多边形内部,您只需将多边形的颜色设置为白色并按原样绘制即可。如果不是这种情况,请参见 rgeos 包 中的 gDifference 函数。一如既往,如果您提供一个小的可重现示例以说明您的进展情况,那么将有助于其他人的理解。 - Andy W
只需提供一个小的可重现示例 :) - João Pesce
1
这个链接可能会有所帮助:http://spatial.ly/2013/12/introduction-spatial-data-ggplot2/ - tonytonov
谢谢,这很有帮助 :) 现在我已经删除了伦敦外的点。这非常有帮助,但问题仍然存在,因为 stat_bin2d 生成的一部分正方形超出了多边形范围。我不想失去精度并按区域进行聚合。 - João Pesce
1个回答

4
我通过获取伦敦边界框和伦敦本身之间的差异多边形(使用gDifference),并将其绘制在所有内容上方,以白色显示答案。我能想到的这种方法的缺点是:1)如果某些正方形仍然出现在它的后面,您必须手动增加多边形的大小。2)您无法使用具有复杂背景的绘图主题。因此,如果有更好的答案,我将保持问题的开放状态一段时间。

以下是代码:

library(rgdal)
library(ggplot2)
library(rgeos)

projection="+proj=merc"

#London boroughs polygons
download.file("http://spatialanalysis.co.uk/wp-content/uploads/2010/09/London_Sport.zip", destfile = "London_Sport.zip")
unzip("London_Sport.zip")
london = readOGR("./", layer="london_sport")
london = spTransform(london, CRS(projection))

# Generate random points
set.seed(1)
points = data.frame(long=rnorm(10000, mean=-0.1, sd=0.1), lat=rnorm(10000, mean=51.5, sd=0.1))
points = SpatialPoints(points, proj4string=CRS("+proj=latlon"))
points = spTransform(points, CRS(projection))

# Keep only points inside London
intersection = gIntersects(points, london, byid = TRUE)
inside = apply(intersection == TRUE, MARGIN = 2, any)
points = points[which(inside), ]

# Create a bounding box 10% bigger than the bounding box of London
x_excess = (london@bbox['x','max'] - london@bbox['x','min'])*0.1
y_excess = (london@bbox['y','max'] - london@bbox['y','min'])*0.1
x_min = london@bbox['x','min'] - x_excess
x_max = london@bbox['x','max'] + x_excess
y_min = london@bbox['y','min'] - y_excess
y_max = london@bbox['y','max'] + y_excess
bbox = matrix(c(x_min,x_max,x_max,x_min,x_min,
                y_min,y_min,y_max,y_max,y_min),
              nrow = 5, ncol =2)
bbox = Polygon(bbox, hole=FALSE)
bbox = Polygons(list(bbox), "bbox")
bbox = SpatialPolygons(Srl=list(bbox), pO=1:1, proj4string=london@proj4string)

# Get the Polygon that is the difference between the bounding box and London
outside = gDifference(bbox,london)

# Blank theme
new_theme_empty <- theme_bw()
new_theme_empty$line <- element_blank()
new_theme_empty$rect <- element_blank()
new_theme_empty$strip.text <- element_blank()
new_theme_empty$axis.text <- element_blank()
new_theme_empty$plot.title <- element_blank()
new_theme_empty$axis.title <- element_blank()
new_theme_empty$plot.margin <- structure(c(0, 0, -1, -1), unit = "lines", valid.unit = 3L, class = "unit")

# Prepare data for ggplot
london = fortify(london)
points = as.data.frame(points)
outside = fortify(outside)

# Plot!
ggplot() + 
  geom_polygon(data=london, aes(x=long,y=lat,group=group), fill="black") +
  stat_bin2d(data=points, aes(x=long,y=lat), bins=40) +
  geom_path(data=london, aes(x=long,y=lat,group=id), colour='white') +
  geom_polygon(data=outside, aes(x=long,y=lat), fill='white') +
  coord_equal() +
  new_theme_empty

Plot


网页内容由stack overflow 提供, 点击上面的
可以查看英文原文,
原文链接