我遇到了一点困难,无法正确输出这个...
到目前为止,我尝试过以下方法:
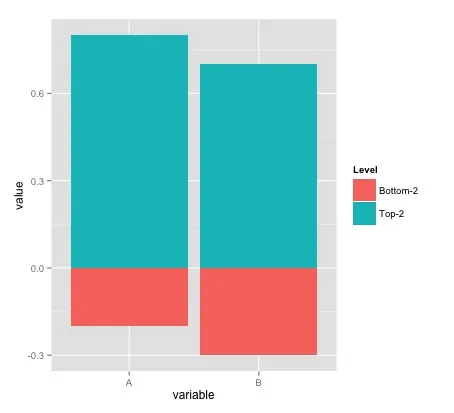
样本数据:
dat <- data.frame(
variable=c("A","B","A","B"),
Level=c("Top-2","Top-2","Bottom-2","Bottom-2"),
value=c(.2,.3,-.2,-.3)
)
这是我目前为止最接近的翻译:
到目前为止,这是我最接近的结果:
ggplot(dat, aes(variable, value, fill=Level)) + geom_bar(position="dodge")
## plots offset, as expected
ggplot(dat, aes(variable, value, fill=Level)) + geom_bar(position="stack")
# or geom_bar(), default is stack but it overplots
Error: Mapping a variable to y and also using stat="bin" ... If you want y to represent counts of cases, use stat="bin" and don't map a variable to y.请参见ggplot2 mapping variable to y and using stat=“bin”。 - smci