你提出的方法中使用了Python循环,因此对于较大的 ni 值,它会变得很慢。不过,除非你要处理大量的 ni ,否则不用太担心。
我已经用下面的代码创建了样本输入数据:
def sample_data(n_i, n_j, z_shape) :
    x = np.random.rand(n_i, n_j) * 1000
    x.sort()
    x[:,0] = 0
    x[:, -1] = 1000
    y = np.random.rand(n_i, n_j)
    z = np.random.rand(*z_shape) * 1000
    return x, y, z
并用这两个版本的线性插值进行了测试:
def interp_1(x, y, z) :
    rows, cols = x.shape
    out = np.empty((rows,) + z.shape, dtype=y.dtype)
    for j in xrange(rows) :
        out[j] =interp1d(x[j], y[j], kind='linear', copy=False)(z)
    return out

def interp_2(x, y, z) :
    rows, cols = x.shape
    row_idx = np.arange(rows).reshape((rows,) + (1,) * z.ndim)
    col_idx = np.argmax(x.reshape(x.shape + (1,) * z.ndim) > z, axis=1) - 1
    ret = y[row_idx, col_idx + 1] - y[row_idx, col_idx]
    ret /= x[row_idx, col_idx + 1] - x[row_idx, col_idx]
    ret *= z - x[row_idx, col_idx]
    ret += y[row_idx, col_idx]
    return ret
interp_1是您代码的优化版本,遵循Dave的答案。interp_2是一种向量化的线性插值实现,完全避免了任何python循环。编写这样的代码需要对numpy中的广播和索引有深刻的理解,某些方面可能会比interp1d更不优化。一个主要例子是找到要插值的bin:一旦interp1d找到bin,它肯定会提前退出循环,而上述函数正在将值与所有bin进行比较。
因此,结果将非常依赖于n_i和n_j是什么,甚至取巧您要插值的值的数组z的长度是多少。如果n_j很小,n_i很大,您应该期望从interp_2中获得优势,并且如果情况相反,则从interp_1中获得优势。较小的z应该有利于interp_2,而更长的则有利于interp_1。
我实际上已经计时了各种n_i和n_j的方法,对于形状为(5,)和(50,)的z,这里是图表:
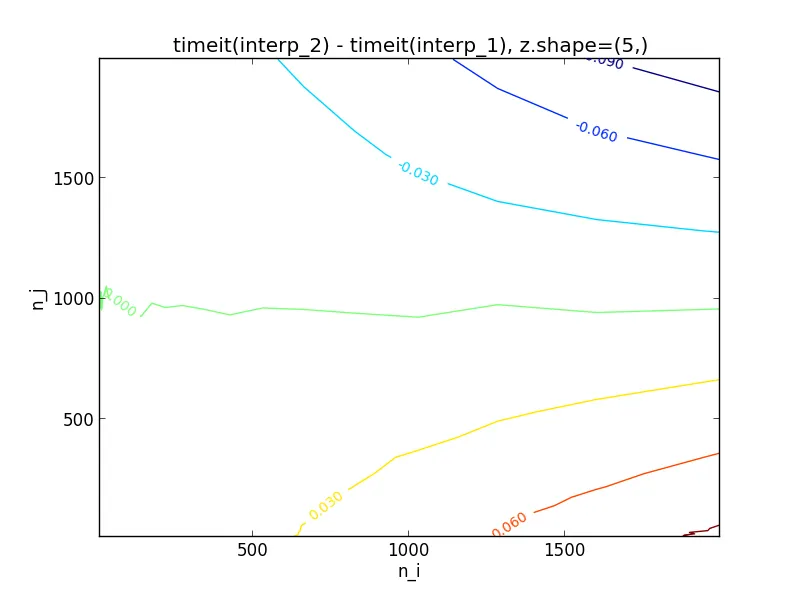
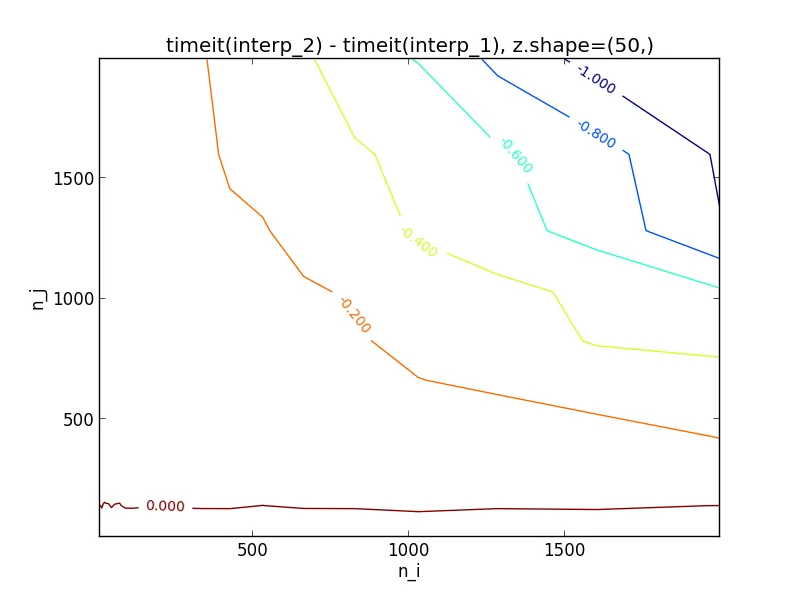
因此,似乎对于形状为(5,)的z,只要n_j < 1000,就应该选择interp_2,否则应该选择interp_1。毫不奇怪,对于形状为(50,)的z,阈值现在大约为n_j < 100。如果您想进一步进行实验,请使用我用于生成图表的代码。
n_s = np.logspace(1, 3.3, 25)
int_1 = np.empty((len(n_s),) * 2)
int_2 = np.empty((len(n_s),) * 2)
z_shape = (5,)

for i, n_i in enumerate(n_s) :
    print int(n_i)
    for j, n_j in enumerate(n_s) :
        x, y, z = sample_data(int(n_i), int(n_j), z_shape)
        int_1[i, j] = min(timeit.repeat('interp_1(x, y, z)',
                                        'from __main__ import interp_1, x, y, z',
                                        repeat=10, number=1))
        int_2[i, j] = min(timeit.repeat('interp_2(x, y, z)',
                                        'from __main__ import interp_2, x, y, z',
                                        repeat=10, number=1))

cs = plt.contour(n_s, n_s, np.transpose(int_1-int_2))
plt.clabel(cs, inline=1, fontsize=10)
plt.xlabel('n_i')
plt.ylabel('n_j')
plt.title('timeit(interp_2) - timeit(interp_1), z.shape=' + str(z_shape))
plt.show()