我一直在查看scipy.interpolate文档中的示例,但是我无法弄清楚如何对不均匀间隔的数据进行插值,因为所有的教程都使用等距空间。例如,我有一些数据分布如下:
[--1--4-----5-3-22---55-]
每个-代表一个缺失值。
我该如何使用scipy.interpolate拟合插值函数?
[--1--4-----5-3-22---55-]
每个-代表一个缺失值。
我该如何使用scipy.interpolate拟合插值函数?
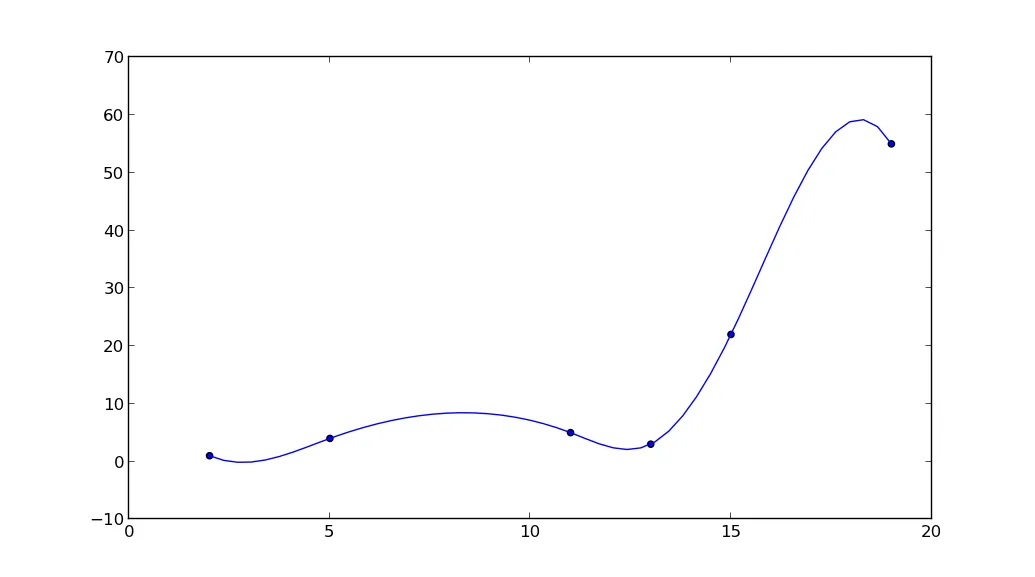
interpolate.interp1d可以很好地处理不均匀间隔的数据。例如,
import re
import numpy as np
import scipy.interpolate as interpolate
import matplotlib.pyplot as plt

text = '--1--4-----5-3-22---55-'
parts = [c for c in re.split(r'(-|\d+)', text) if c]
data = np.array([(x, int(y)) for x, y in enumerate(parts) if y != '-'])
x, y = data.T
f = interpolate.interp1d(x, y, kind='cubic')

newx = np.linspace(x.min(), x.max())
newy = f(newx)
plt.plot(newx, newy)
plt.scatter(x, y, s=20)
plt.show()
bounds_error=False。 - Stefano M
x向量设置为具有数据的索引,将y向量设置为这些索引处的值吗?我不确定这在你的情况下是否有效,但这是我想到的。 - Engineero