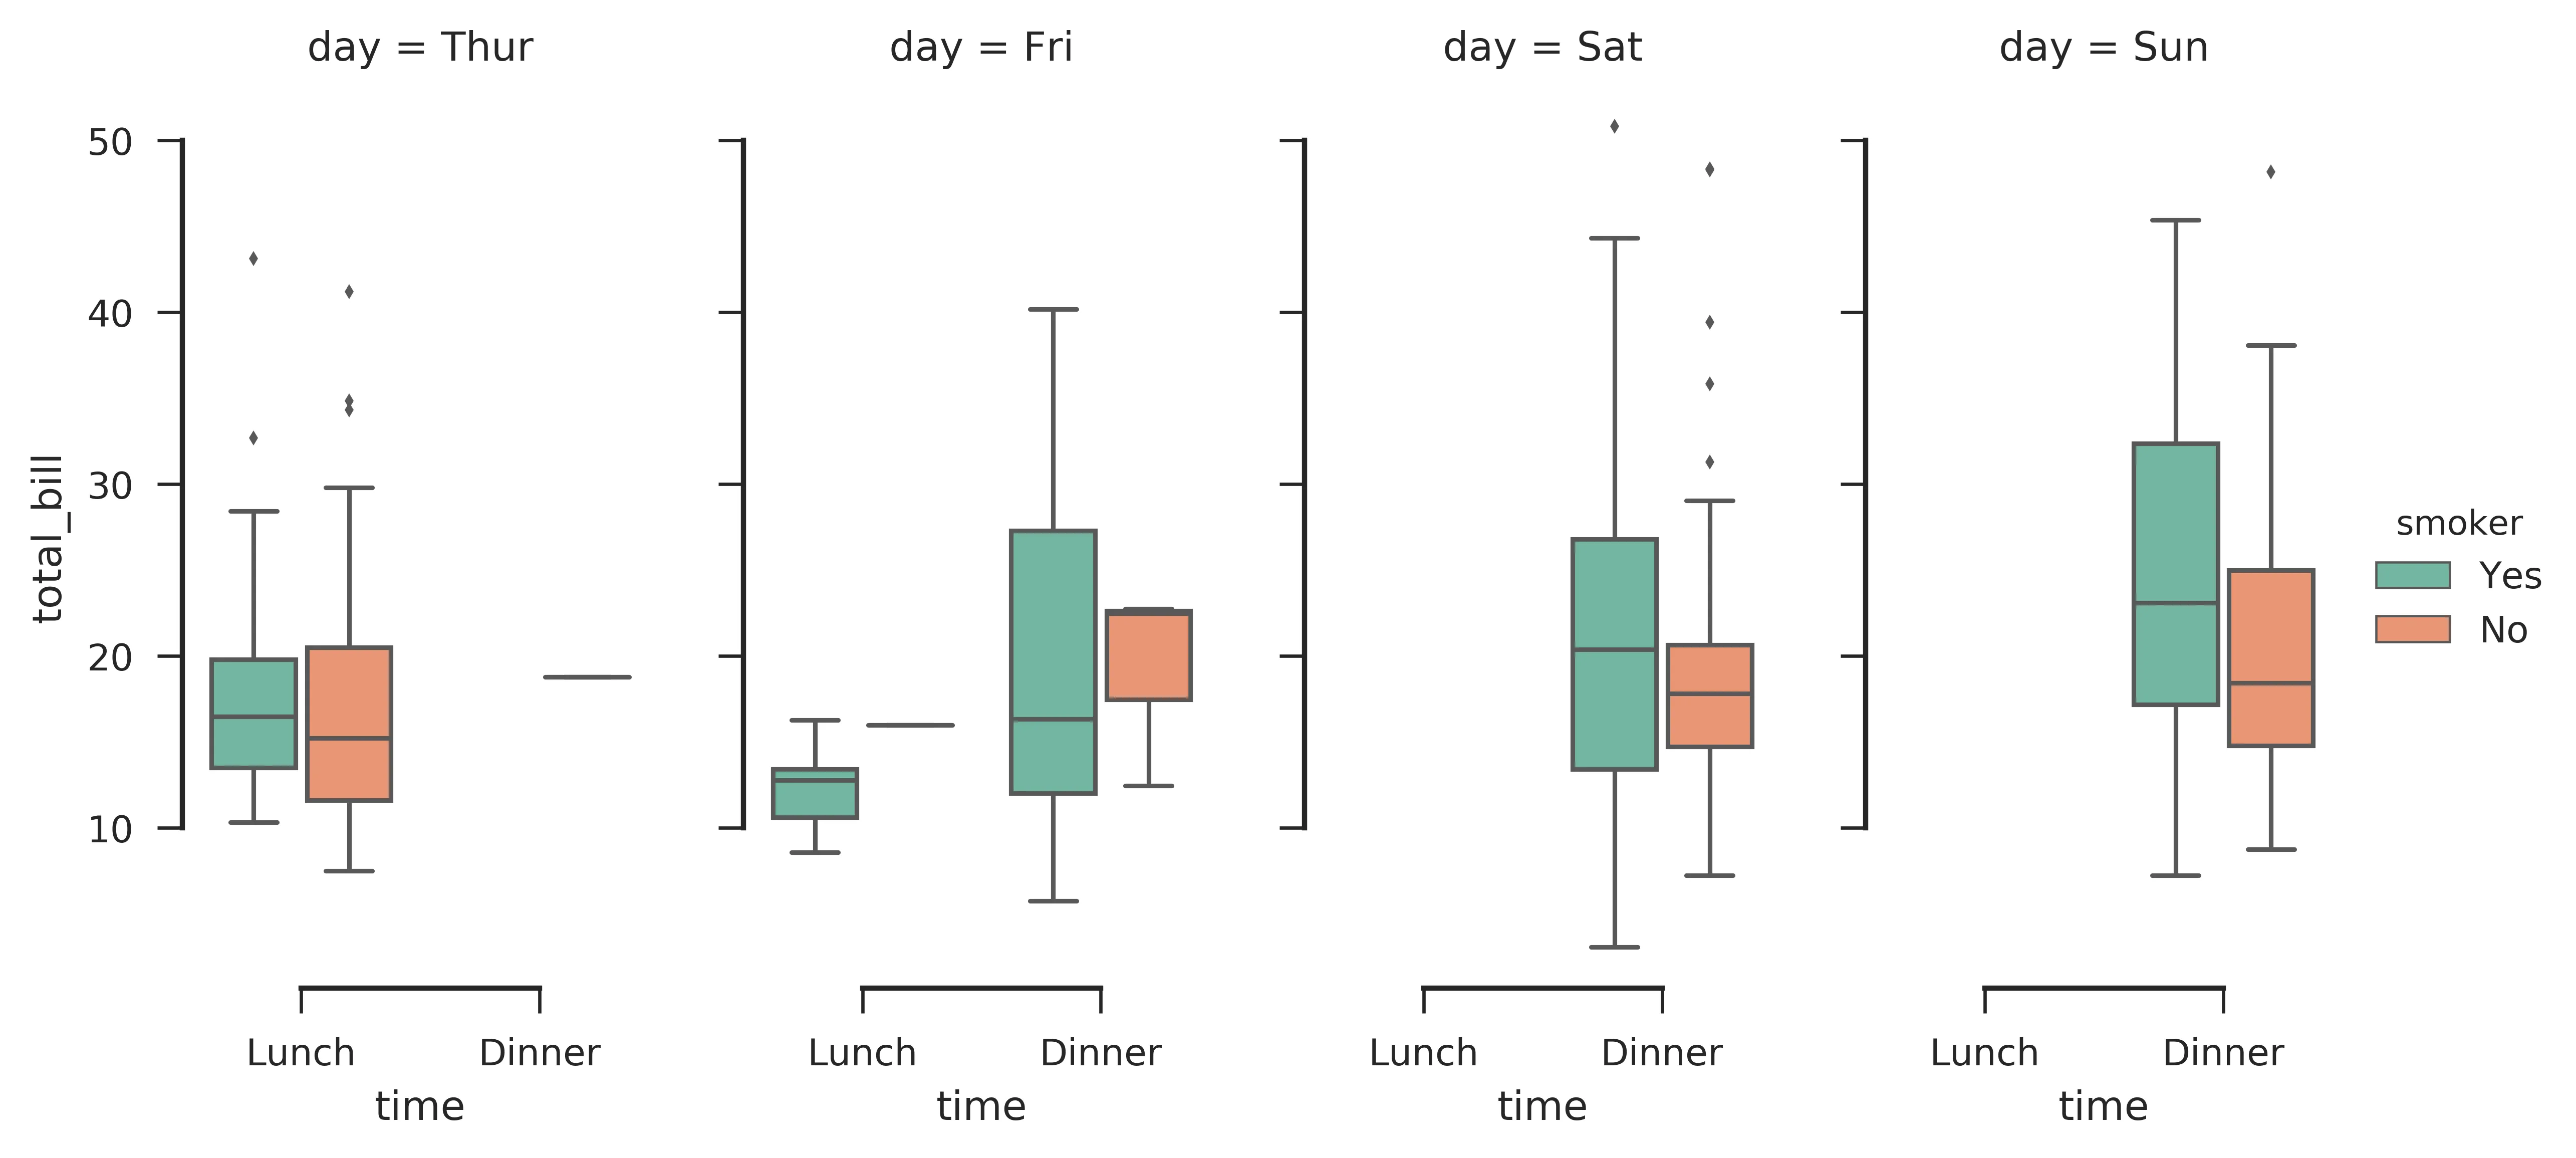
如何在Python中使用Seaborn生成嵌套盒形图时设置盒形图之间的间距?

6
我想设置Python Seaborn 模块的sns.boxplot()之间的空格(在绿色和橙色框之间)。请参见附图,绿色和橙色子图框紧贴在一起,视觉效果不是最佳的。无法找到方法来实现此目标,有人可以找到方法吗?(代码附在下面)

Seaborn Boxplots

import numpy as np
import pandas as pd
import matplotlib as mpl
import matplotlib.pyplot as plt
import seaborn as sns
tips = sns.load_dataset("tips")
sns.set(style="ticks", palette='Set2', font='Roboto Condensed')
sns.set_context("paper", font_scale=1.1, rc={"lines.linewidth": 1.1})
g=sns.factorplot(x="time", y="total_bill", hue="smoker",
               col="day", data=tips, kind="box", size=4, aspect=0.5,
                 width=0.8,fliersize=2.5,linewidth=1.1, notch=False,orient="v")
sns.despine(trim=True)
g.savefig('test6.png', format='png', dpi=600)

Seaborn 箱线图文档在这里:http://stanford.edu/~mwaskom/software/seaborn/generated/seaborn.boxplot.html

1个回答

2

在运行时有可能不再需要这个,但我找到了解决这个问题的方法。当直接使用matplotlib绘制箱线图时,可以通过widthposition关键字来控制箱子的排列。然而,当将positions关键字传递给sns.factorplot(kind='box',...)时,会得到一个...

TypeError: boxplot() got multiple values for keyword argument 'positions'

为了解决这个问题,可以在盒图创建之后“手动”设置盒子的宽度。这有点繁琐,因为盒子存储为 sns.factorplot 返回的各个 Axes 实例内的 PatchPatches. 的形式。与Rects的简单语法 (x,y,width,height) 不同,PathPatches使用顶点定义角落,当调整盒子时需要进行稍微更多的计算。除其他外,matplotlib.boxplot返回的 PathPatches 包含一个额外的(被忽略的)顶点用于 Path.CLOSEPOLY 代码,将其设置为 (0,0) 并忽略即可。除了盒子之外,标记中位数的水平线现在也太宽了,需要进行调整。
下面我定义了一个函数来调整由 OP 的示例代码生成的盒子的宽度(请注意额外的导入)。
from matplotlib.patches import PathPatch
def adjust_box_widths(g, fac):
    """
    Adjust the withs of a seaborn-generated boxplot.
    """

    ##iterating through Axes instances
    for ax in g.axes.flatten():

        ##iterating through axes artists:
        for c in ax.get_children():

            ##searching for PathPatches
            if isinstance(c, PathPatch):
                ##getting current width of box:
                p = c.get_path()
                verts = p.vertices
                verts_sub = verts[:-1]
                xmin = np.min(verts_sub[:,0])
                xmax = np.max(verts_sub[:,0])
                xmid = 0.5*(xmin+xmax)
                xhalf = 0.5*(xmax - xmin)

                ##setting new width of box
                xmin_new = xmid-fac*xhalf
                xmax_new = xmid+fac*xhalf
                verts_sub[verts_sub[:,0] == xmin,0] = xmin_new
                verts_sub[verts_sub[:,0] == xmax,0] = xmax_new

                ##setting new width of median line
                for l in ax.lines:
                    if np.all(l.get_xdata() == [xmin,xmax]):
                        l.set_xdata([xmin_new,xmax_new])

调用这个函数时,需要使用以下参数:
adjust_box_widths(g, 0.9)

输出结果如下:

带有调整框宽的seaborn箱线图


网页内容由stack overflow 提供, 点击上面的
可以查看英文原文,
原文链接