在Matlab中,是否有可能为2-D线条添加渐变色,特别是当您只有少量数据点(少于10个)时,结果类似于下面图片中的效果?
在Matlab中,是否有可能为2-D线条添加渐变色,特别是当您只有少量数据点(少于10个)时,结果类似于下面图片中的效果?
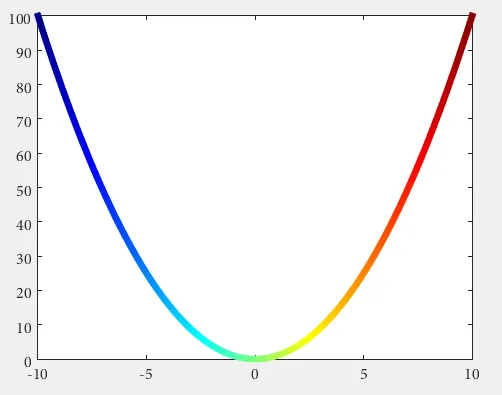
n = 100;
x = linspace(-10,10,n); y = x.^2;
p = plot(x,y,'r', 'LineWidth',5);

% modified jet-colormap
cd = [uint8(jet(n)*255) uint8(ones(n,1))].';

drawnow
set(p.Edge, 'ColorBinding','interpolated', 'ColorData',cd)
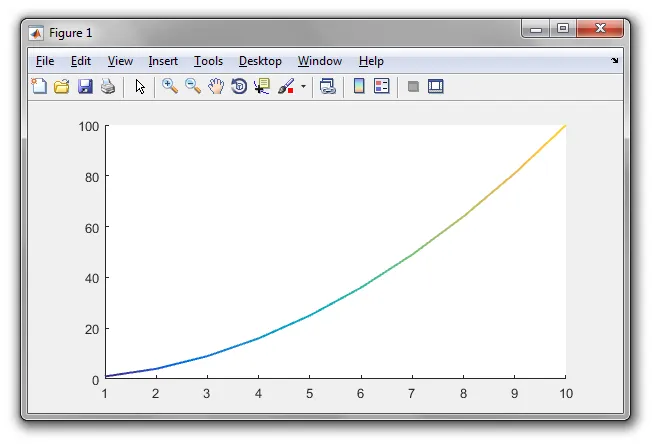
x = 1:10; % x data. Assumed to be increasing
y = x.^2; % y data
N = 100; % number of colors. Assumed to be greater than size of x
cmap = parula(N); % colormap, with N colors
linewidth = 1.5; % desired linewidth
xi = x(1)+linspace(0,1,N+1)*x(end); % interpolated x values
yi = interp1(x,y,xi); % interpolated y values
hold on
for n = 1:N
    plot(xi([n n+1]), yi([n n+1]), 'color', cmap(n,:), 'linewidth', linewidth);
end