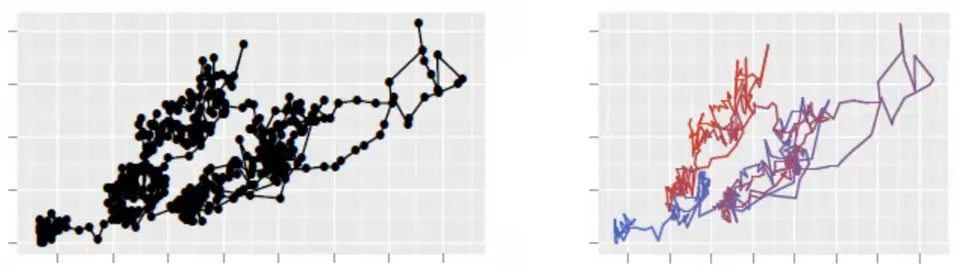
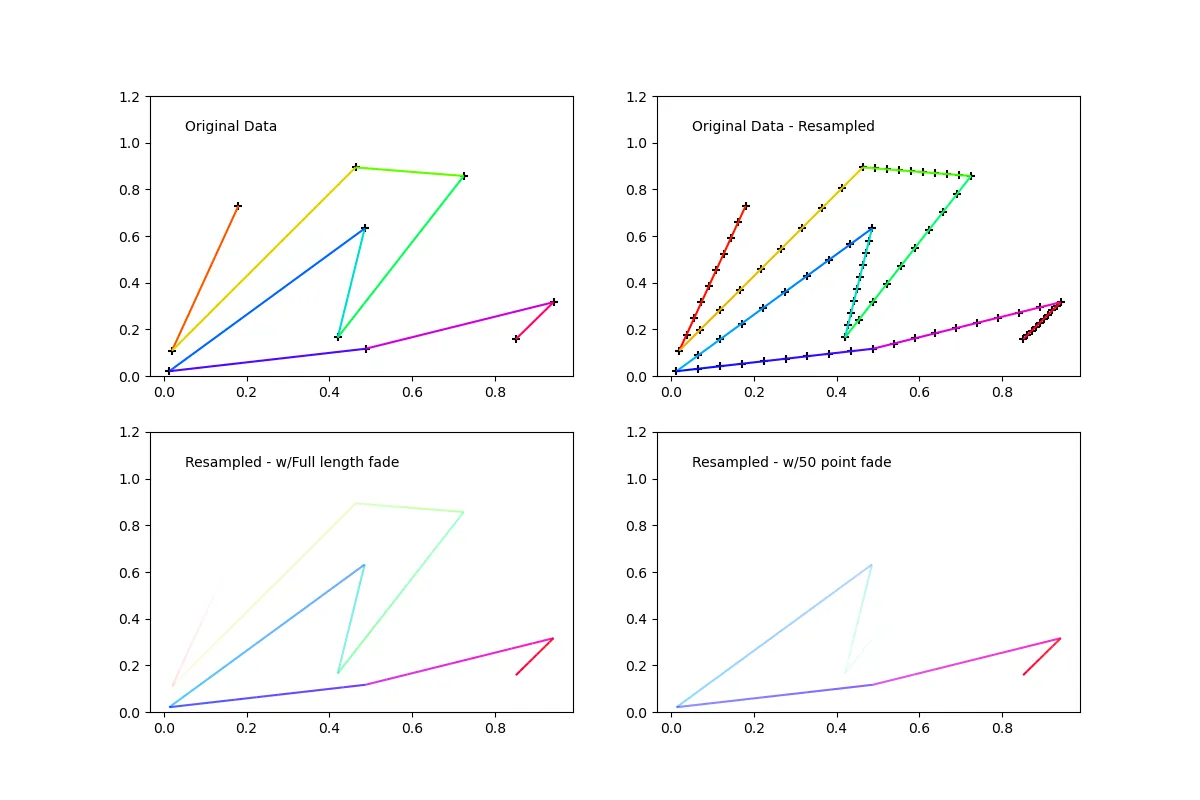
建立在Yann的回复之上,我将其扩展以涵盖线点的任意着色。沿着线条,在一个点和下一个点之间进行RGB插值。Alpha可以单独设置。实际上,我需要这个解决方案来制作动画,其中一部分线条被淡出并动态更新,因此我还添加了设置淡出长度和方向的功能。希望对某些人有所帮助。
请参见附带的示例图。
import matplotlib.pyplot as plt
import numpy as np
from matplotlib import collections as mc
from scipy.interpolate import interp1d
from matplotlib.colors import colorConverter
def colored_line_segments(xs,ys,color):
if isinstance(color,str):
color = colorConverter.to_rgba(color)[:-1]
color = np.array([color for i in range(len(xs))])
segs = []
seg_colors = []
lastColor = [color[0][0],color[0][1],color[0][2]]
start = [xs[0],ys[0]]
end = [xs[0],ys[0]]
for x,y,c in zip(xs,ys,color):
seg_colors.append([(chan+lastChan)*.5 for chan,lastChan in zip(c,lastColor)])
lastColor = [c[0],c[1],c[2]]
start = [end[0],end[1]]
end = [x,y]
segs.append([start,end])
colors = [(*color,1) for color in seg_colors]
lc = mc.LineCollection(segs, colors=colors)
return lc, segs, colors
def segmented_resample(xs,ys,color,n_resample=100):
n_points = len(xs)
if isinstance(color,str):
color = colorConverter.to_rgba(color)[:-1]
color = np.array([color for i in range(n_points)])
n_segs = (n_points-1)*(n_resample-1)
xsInterp = np.linspace(0,1,n_resample)
segs = []
seg_colors = []
hiResXs = [xs[0]]
hiResYs = [ys[0]]
RGB = color.swapaxes(0,1)
for i in range(n_points-1):
fit_xHiRes = interp1d([0,1],xs[i:i+2])
fit_yHiRes = interp1d(xs[i:i+2],ys[i:i+2])
xHiRes = fit_xHiRes(xsInterp)
yHiRes = fit_yHiRes(xHiRes)
hiResXs = hiResXs+list(xHiRes[1:])
hiResYs = hiResYs+list(yHiRes[1:])
R_HiRes = interp1d([0,1],RGB[0][i:i+2])(xHiRes)
G_HiRes = interp1d([0,1],RGB[1][i:i+2])(xHiRes)
B_HiRes = interp1d([0,1],RGB[2][i:i+2])(xHiRes)
lastColor = [R_HiRes[0],G_HiRes[0],B_HiRes[0]]
start = [xHiRes[0],yHiRes[0]]
end = [xHiRes[0],yHiRes[0]]
for x,y,r,g,b in zip(xHiRes[1:],yHiRes[1:],R_HiRes[1:],G_HiRes[1:],B_HiRes[1:]):
seg_colors.append([(chan+lastChan)*.5 for chan,lastChan in zip((r,g,b),lastColor)])
lastColor = [r,g,b]
start = [end[0],end[1]]
end = [x,y]
segs.append([start,end])
colors = [(*color,1) for color in seg_colors]
return segs, colors, [hiResXs,hiResYs]
def fadeCollection(xs,ys,color,fade_len=20,n_resample=100,direction='Head'):
segs, colors, hiResData = segmented_resample(xs,ys,color,n_resample)
n_segs = len(segs)
if fade_len>len(segs):
fade_len=n_segs
if direction=='Head':
alphas = np.concatenate((np.zeros(n_segs-fade_len),np.linspace(0,1,fade_len)))
else:
alphas = np.concatenate((np.linspace(1,0,fade_len),np.zeros(n_segs-fade_len)))
colors = [(*color[:-1],alpha) for color,alpha in zip(colors,alphas)]
lc = mc.LineCollection(segs, colors=colors)
return segs, colors, hiResData
if __name__ == "__main__":
NPOINTS = 10
RESAMPLE = 10
N_FADE = int(RESAMPLE*NPOINTS*0.5)
N_SEGS = (NPOINTS-1)*(RESAMPLE-1)
SHOW_POINTS_AXI_12 = True
SHOW_POINTS_AXI_34 = False
np.random.seed(11)
xs = np.random.rand(NPOINTS)
ys = np.random.rand(NPOINTS)
COLOR='b'
MARKER_COLOR = 'k'
MARKER = '+'
CMAP = plt.get_cmap('hsv')
COLORS = np.array([CMAP(i)[:-1] for i in np.linspace(0,1,NPOINTS)])
fig = plt.figure(figsize=(12,8),dpi=100)
ax1 = fig.add_subplot(221)
lc, segs, colors = colored_line_segments(xs,ys,COLORS)
if SHOW_POINTS_AXI_12: ax1.scatter(xs,ys,marker=MARKER,color=MARKER_COLOR)
ax1.add_collection(lc)
ax1.text(.05,1.05,'Original Data')
ax1.set_ylim(0,1.2)
ax2 = fig.add_subplot(222, sharex=ax1, sharey=ax1)
segs, colors, hiResData = segmented_resample(xs,ys,COLORS,RESAMPLE)
if SHOW_POINTS_AXI_12: ax2.scatter(hiResData[0],hiResData[1],marker=MARKER,color=MARKER_COLOR)
ax2.add_collection(mc.LineCollection(segs, colors=colors))
ax2.text(.05,1.05,'Original Data - Resampled')
ax2.set_ylim(0,1.2)
ax3 = fig.add_subplot(223, sharex=ax1, sharey=ax1)
segs, colors, hiResData = fadeCollection(xs,ys,COLORS,fade_len=RESAMPLE*NPOINTS,n_resample=RESAMPLE,direction='Head')
if SHOW_POINTS_AXI_34: ax3.scatter(hiResData[0],hiResData[1],marker=MARKER,color=MARKER_COLOR)
ax3.add_collection(mc.LineCollection(segs, colors=colors))
ax3.text(.05,1.05,'Resampled - w/Full length fade')
ax3.set_ylim(0,1.2)
ax4 = fig.add_subplot(224, sharex=ax1, sharey=ax1)
segs, colors, hiResData = fadeCollection(xs,ys,COLORS,fade_len=N_FADE,n_resample=RESAMPLE,direction='Head')
if SHOW_POINTS_AXI_34: ax4.scatter(hiResData[0],hiResData[1],marker=MARKER,color=MARKER_COLOR)
ax4.add_collection(mc.LineCollection(segs, colors=colors))
ax4.text(.05,1.05,'Resampled - w/{} point fade'.format(N_FADE))
ax4.set_ylim(0,1.2)
fig.savefig('fadeSegmentedColorLine.png')
plt.show()
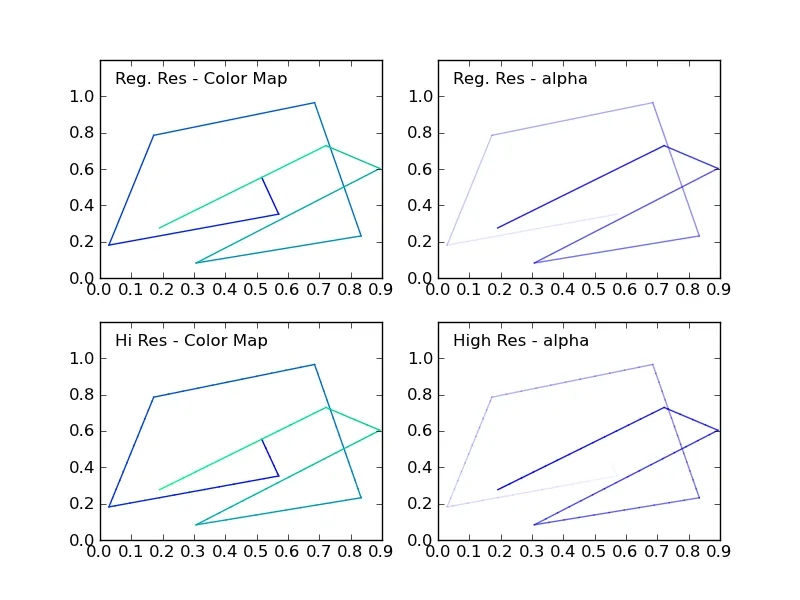
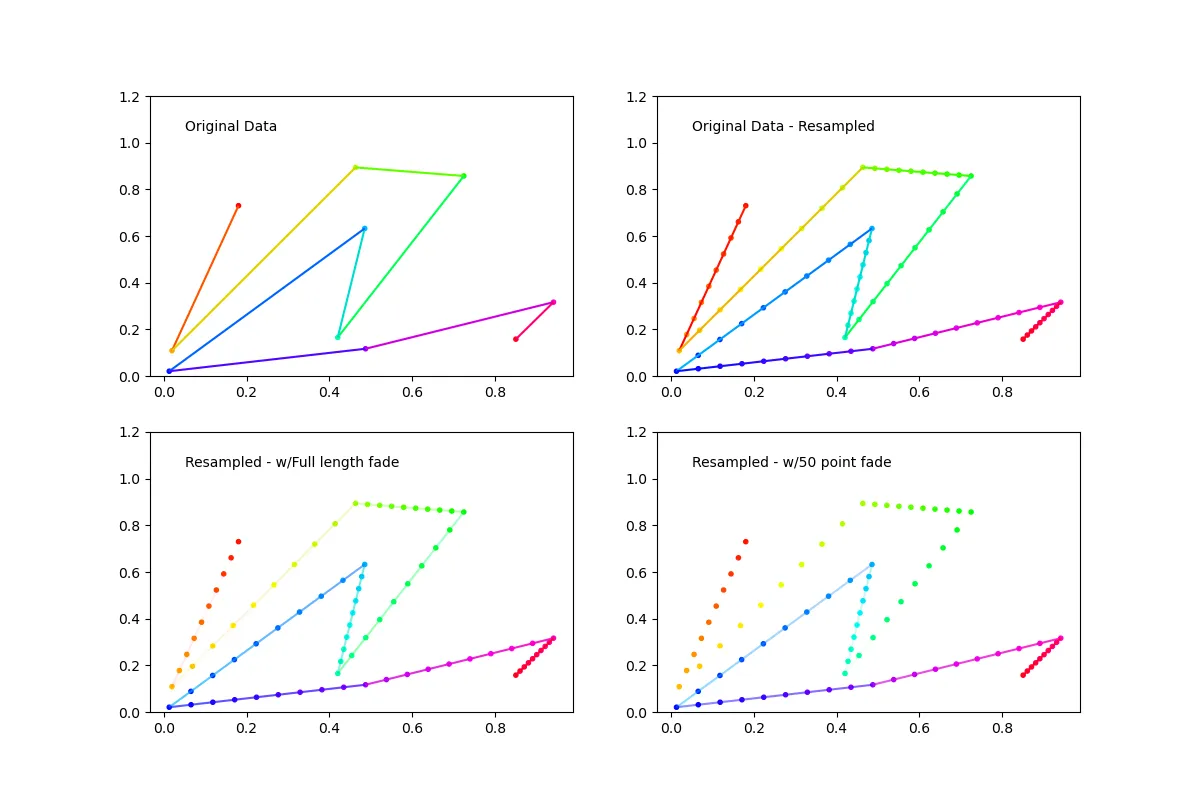
更新:
分段颜色不会完全复制基础点颜色的方式让我感到困扰,所以我添加了一个标志来改变分段颜色插值的方式,可以选择中间或前向。由于有n-1个分段和n个点,你不能完美地匹配分段颜色,但现在它们至少在一端匹配。这也消除了以前RGB通道平均引起的模糊效果,我想在某些情况下你可能仍然希望使用更平滑的版本,因此它仍然存在。
import matplotlib.pyplot as plt
import numpy as np
from matplotlib import collections as mc
from scipy.interpolate import interp1d
from matplotlib.colors import colorConverter
def colored_line_segments(xs,ys,color,mid_colors=False):
if isinstance(color,str):
color = colorConverter.to_rgba(color)[:-1]
color = np.array([color for i in range(len(xs))])
segs = []
seg_colors = []
lastColor = [color[0][0],color[0][1],color[0][2]]
start = [xs[0],ys[0]]
end = [xs[0],ys[0]]
for x,y,c in zip(xs,ys,color):
if mid_colors:
seg_colors.append([(chan+lastChan)*.5 for chan,lastChan in zip(c,lastColor)])
else:
seg_colors.append(c)
lastColor = [c[0],c[1],c[2]]
start = [end[0],end[1]]
end = [x,y]
segs.append([start,end])
colors = [(*color,1) for color in seg_colors]
lc = mc.LineCollection(segs, colors=colors)
return lc, segs, colors
def segmented_resample(xs,ys,color,n_resample=100,mid_colors=False):
n_points = len(xs)
if isinstance(color,str):
color = colorConverter.to_rgba(color)[:-1]
color = np.array([color for i in range(n_points)])
n_segs = (n_points-1)*(n_resample-1)
xsInterp = np.linspace(0,1,n_resample)
segs = []
seg_colors = []
hiResXs = [xs[0]]
hiResYs = [ys[0]]
RGB = color.swapaxes(0,1)
for i in range(n_points-1):
fit_xHiRes = interp1d([0,1],xs[i:i+2])
fit_yHiRes = interp1d(xs[i:i+2],ys[i:i+2])
xHiRes = fit_xHiRes(xsInterp)
yHiRes = fit_yHiRes(xHiRes)
hiResXs = hiResXs+list(xHiRes[1:])
hiResYs = hiResYs+list(yHiRes[1:])
R_HiRes = interp1d([0,1],RGB[0][i:i+2])(xHiRes)
G_HiRes = interp1d([0,1],RGB[1][i:i+2])(xHiRes)
B_HiRes = interp1d([0,1],RGB[2][i:i+2])(xHiRes)
lastColor = [R_HiRes[0],G_HiRes[0],B_HiRes[0]]
start = [xHiRes[0],yHiRes[0]]
end = [xHiRes[0],yHiRes[0]]
if mid_colors: seg_colors.append([R_HiRes[0],G_HiRes[0],B_HiRes[0]])
for x,y,r,g,b in zip(xHiRes[1:],yHiRes[1:],R_HiRes[1:],G_HiRes[1:],B_HiRes[1:]):
if mid_colors:
seg_colors.append([(chan+lastChan)*.5 for chan,lastChan in zip((r,g,b),lastColor)])
else:
seg_colors.append([r,g,b])
lastColor = [r,g,b]
start = [end[0],end[1]]
end = [x,y]
segs.append([start,end])
colors = [(*color,1) for color in seg_colors]
return segs, colors, [hiResXs,hiResYs]
def faded_segment_resample(xs,ys,color,fade_len=20,n_resample=100,direction='Head'):
segs, colors, hiResData = segmented_resample(xs,ys,color,n_resample)
n_segs = len(segs)
if fade_len>len(segs):
fade_len=n_segs
if direction=='Head':
alphas = np.concatenate((np.zeros(n_segs-fade_len),np.linspace(0,1,fade_len)))
else:
alphas = np.concatenate((np.linspace(1,0,fade_len),np.zeros(n_segs-fade_len)))
colors = [(*color[:-1],alpha) for color,alpha in zip(colors,alphas)]
lc = mc.LineCollection(segs, colors=colors)
return segs, colors, hiResData
if __name__ == "__main__":
NPOINTS = 10
RESAMPLE = 10
N_FADE = int(RESAMPLE*NPOINTS*0.5)
N_SEGS = (NPOINTS-1)*(RESAMPLE-1)
SHOW_POINTS_AXI_12 = True
SHOW_POINTS_AXI_34 = True
np.random.seed(11)
xs = np.random.rand(NPOINTS)
ys = np.random.rand(NPOINTS)
COLOR='b'
MARKER = '.'
CMAP = plt.get_cmap('hsv')
COLORS = np.array([CMAP(i)[:-1] for i in np.linspace(0,1,NPOINTS)])
MARKER_COLOR = COLORS
N_SCATTER = (NPOINTS-1)*(RESAMPLE-1)+1
COLORS_LONG = np.array([CMAP(i)[:-1] for i in np.linspace(1/N_SCATTER,1,N_SCATTER)])
fig = plt.figure(figsize=(12,8),dpi=100)
ax1 = fig.add_subplot(221)
lc, segs, colors = colored_line_segments(xs,ys,COLORS,True)
if SHOW_POINTS_AXI_12: ax1.scatter(xs,ys,marker=MARKER,color=COLORS)
ax1.add_collection(lc)
ax1.text(.05,1.05,'Original Data')
ax1.set_ylim(0,1.2)
ax2 = fig.add_subplot(222, sharex=ax1, sharey=ax1)
segs, colors, hiResData = segmented_resample(xs,ys,COLORS,RESAMPLE)
if SHOW_POINTS_AXI_12: ax2.scatter(hiResData[0],hiResData[1],marker=MARKER,color=COLORS_LONG)
ax2.add_collection(mc.LineCollection(segs, colors=colors))
ax2.text(.05,1.05,'Original Data - Resampled')
ax2.set_ylim(0,1.2)
ax3 = fig.add_subplot(223, sharex=ax1, sharey=ax1)
segs, colors, hiResData = faded_segment_resample(xs,ys,COLORS,fade_len=RESAMPLE*NPOINTS,n_resample=RESAMPLE,direction='Head')
if SHOW_POINTS_AXI_34: ax3.scatter(hiResData[0],hiResData[1],marker=MARKER,color=COLORS_LONG)
ax3.add_collection(mc.LineCollection(segs, colors=colors))
ax3.text(.05,1.05,'Resampled - w/Full length fade')
ax3.set_ylim(0,1.2)
ax4 = fig.add_subplot(224, sharex=ax1, sharey=ax1)
segs, colors, hiResData = faded_segment_resample(xs,ys,COLORS,fade_len=N_FADE,n_resample=RESAMPLE,direction='Head')
if SHOW_POINTS_AXI_34: ax4.scatter(hiResData[0],hiResData[1],marker=MARKER,color=COLORS_LONG)
ax4.add_collection(mc.LineCollection(segs, colors=colors))
ax4.text(.05,1.05,'Resampled - w/{} point fade'.format(N_FADE))
ax4.set_ylim(0,1.2)
fig.savefig('fadeSegmentedColorLine.png')
plt.show()
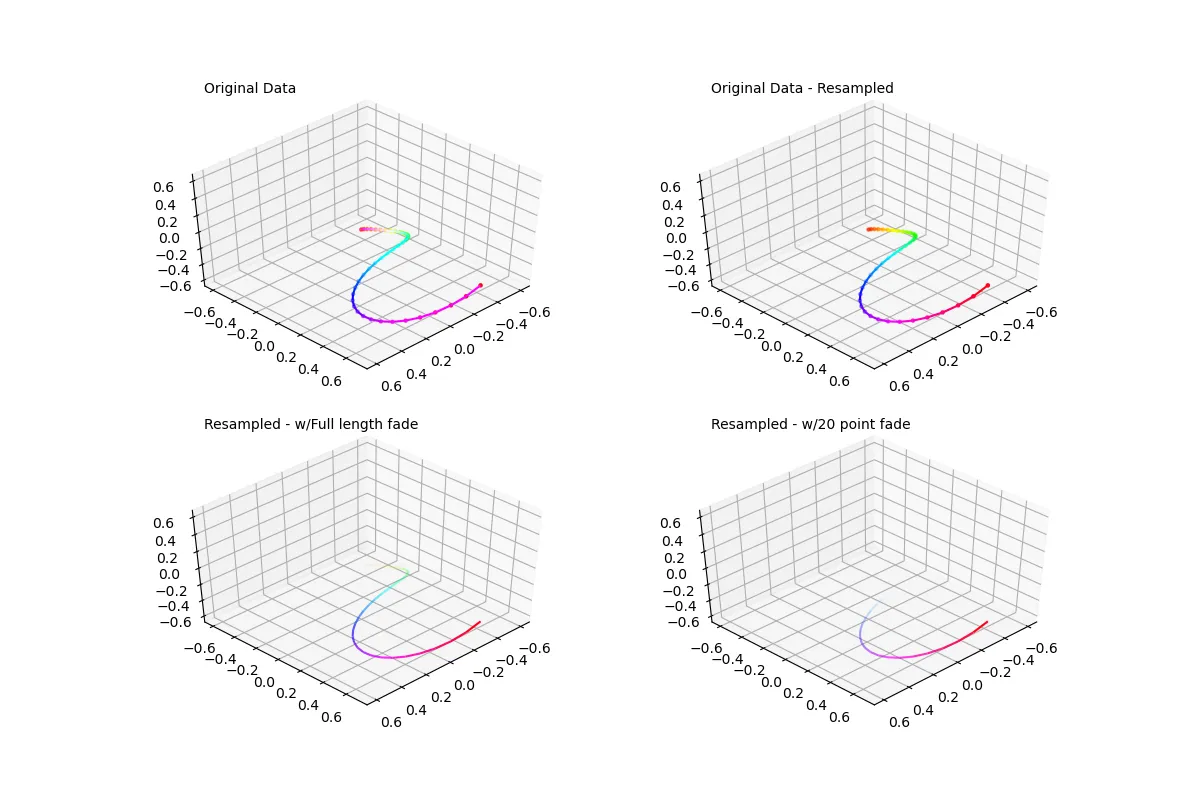
更新2:
保证这是最后一次更新..但我将其扩展到了3D,并更正了一些之前由于测试数据在0,1范围内而未能发现的错误。
import numpy as np
from matplotlib.collections import LineCollection as lc
from mpl_toolkits.mplot3d.art3d import Line3DCollection as lc3d
from scipy.interpolate import interp1d
from matplotlib.colors import colorConverter
def colored_line_segments(xs,ys,zs=None,color='k',mid_colors=False):
if isinstance(color,str):
color = colorConverter.to_rgba(color)[:-1]
color = np.array([color for i in range(len(xs))])
segs = []
seg_colors = []
lastColor = [color[0][0],color[0][1],color[0][2]]
start = [xs[0],ys[0]]
end = [xs[0],ys[0]]
if not zs is None:
start.append(zs[0])
end.append(zs[0])
else:
zs = [zs]*len(xs)
for x,y,z,c in zip(xs,ys,zs,color):
if mid_colors:
seg_colors.append([(chan+lastChan)*.5 for chan,lastChan in zip(c,lastColor)])
else:
seg_colors.append(c)
lastColor = c[:-1]
if not z is None:
start = [end[0],end[1],end[2]]
end = [x,y,z]
else:
start = [end[0],end[1]]
end = [x,y]
segs.append([start,end])
colors = [(*color,1) for color in seg_colors]
return segs, colors
def segmented_resample(xs,ys,zs=None,color='k',n_resample=100,mid_colors=False):
n_points = len(xs)
if isinstance(color,str):
color = colorConverter.to_rgba(color)[:-1]
color = np.array([color for i in range(n_points)])
n_segs = (n_points-1)*(n_resample-1)
xsInterp = np.linspace(0,1,n_resample)
segs = []
seg_colors = []
hiResXs = [xs[0]]
hiResYs = [ys[0]]
if not zs is None:
hiResZs = [zs[0]]
RGB = color.swapaxes(0,1)
for i in range(n_points-1):
fit_xHiRes = interp1d([0,1],xs[i:i+2])
fit_yHiRes = interp1d([0,1],ys[i:i+2])
xHiRes = fit_xHiRes(xsInterp)
yHiRes = fit_yHiRes(xsInterp)
hiResXs = hiResXs+list(xHiRes[1:])
hiResYs = hiResYs+list(yHiRes[1:])
R_HiRes = interp1d([0,1],RGB[0][i:i+2])(xsInterp)
G_HiRes = interp1d([0,1],RGB[1][i:i+2])(xsInterp)
B_HiRes = interp1d([0,1],RGB[2][i:i+2])(xsInterp)
lastColor = [R_HiRes[0],G_HiRes[0],B_HiRes[0]]
start = [xHiRes[0],yHiRes[0]]
end = [xHiRes[0],yHiRes[0]]
if not zs is None:
fit_zHiRes = interp1d([0,1],zs[i:i+2])
zHiRes = fit_zHiRes(xsInterp)
hiResZs = hiResZs+list(zHiRes[1:])
start.append(zHiRes[0])
end.append(zHiRes[0])
else:
zHiRes = [zs]*len(xHiRes)
if mid_colors: seg_colors.append([R_HiRes[0],G_HiRes[0],B_HiRes[0]])
for x,y,z,r,g,b in zip(xHiRes[1:],yHiRes[1:],zHiRes[1:],R_HiRes[1:],G_HiRes[1:],B_HiRes[1:]):
if mid_colors:
seg_colors.append([(chan+lastChan)*.5 for chan,lastChan in zip((r,g,b),lastColor)])
else:
seg_colors.append([r,g,b])
lastColor = [r,g,b]
if not z is None:
start = [end[0],end[1],end[2]]
end = [x,y,z]
else:
start = [end[0],end[1]]
end = [x,y]
segs.append([start,end])
colors = [(*color,1) for color in seg_colors]
data = [hiResXs,hiResYs]
if not zs is None:
data = [hiResXs,hiResYs,hiResZs]
return segs, colors, data
def faded_segment_resample(xs,ys,zs=None,color='k',fade_len=20,n_resample=100,direction='Head'):
segs, colors, hiResData = segmented_resample(xs,ys,zs,color,n_resample)
n_segs = len(segs)
if fade_len>len(segs):
fade_len=n_segs
if direction=='Head':
alphas = np.concatenate((np.zeros(n_segs-fade_len),np.linspace(0,1,fade_len)))
else:
alphas = np.concatenate((np.linspace(1,0,fade_len),np.zeros(n_segs-fade_len)))
colors = [(*color[:-1],alpha) for color,alpha in zip(colors,alphas)]
return segs, colors, hiResData
def test2d():
NPOINTS = 10
RESAMPLE = 10
N_FADE = int(RESAMPLE*NPOINTS*0.5)
N_SEGS = (NPOINTS-1)*(RESAMPLE-1)
SHOW_POINTS_AXI_12 = True
SHOW_POINTS_AXI_34 = True
np.random.seed(11)
xs = np.random.rand(NPOINTS)
ys = np.random.rand(NPOINTS)
MARKER = '.'
CMAP = plt.get_cmap('hsv')
COLORS = np.array([CMAP(i)[:-1] for i in np.linspace(0,1,NPOINTS)])
MARKER_COLOR = COLORS
N_SCATTER = (NPOINTS-1)*(RESAMPLE-1)+1
COLORS_LONG = np.array([CMAP(i)[:-1] for i in np.linspace(1/N_SCATTER,1,N_SCATTER)])
fig = plt.figure(figsize=(12,8),dpi=100)
ax1 = fig.add_subplot(221)
segs, colors = colored_line_segments(xs,ys,color=COLORS,mid_colors=True)
if SHOW_POINTS_AXI_12: ax1.scatter(xs,ys,marker=MARKER,color=COLORS)
ax1.add_collection(lc(segs, colors=colors))
ax1.text(.05,1.05,'Original Data')
ax1.set_ylim(0,1.2)
ax2 = fig.add_subplot(222, sharex=ax1, sharey=ax1)
segs, colors, hiResData = segmented_resample(xs,ys,color=COLORS,n_resample=RESAMPLE)
if SHOW_POINTS_AXI_12: ax2.scatter(hiResData[0],hiResData[1],marker=MARKER,color=COLORS_LONG)
ax2.add_collection(lc(segs, colors=colors))
ax2.text(.05,1.05,'Original Data - Resampled')
ax2.set_ylim(0,1.2)
ax3 = fig.add_subplot(223, sharex=ax1, sharey=ax1)
segs, colors, hiResData = faded_segment_resample(xs,ys,color=COLORS,fade_len=RESAMPLE*NPOINTS,n_resample=RESAMPLE,direction='Head')
if SHOW_POINTS_AXI_34: ax3.scatter(hiResData[0],hiResData[1],marker=MARKER,color=COLORS_LONG)
ax3.add_collection(lc(segs, colors=colors))
ax3.text(.05,1.05,'Resampled - w/Full length fade')
ax3.set_ylim(0,1.2)
ax4 = fig.add_subplot(224, sharex=ax1, sharey=ax1)
segs, colors, hiResData = faded_segment_resample(xs,ys,color=COLORS,fade_len=N_FADE,n_resample=RESAMPLE,direction='Head')
if SHOW_POINTS_AXI_34: ax4.scatter(hiResData[0],hiResData[1],marker=MARKER,color=COLORS_LONG)
ax4.add_collection(lc(segs, colors=colors))
ax4.text(.05,1.05,'Resampled - w/{} point fade'.format(N_FADE))
ax4.set_ylim(0,1.2)
fig.savefig('2d_fadeSegmentedColorLine.png')
plt.show()
def test3d():
def set_view(axi):
axi.set_xlim(-.65,.65)
axi.set_ylim(-.65,.75)
axi.set_zlim(-.65,.65)
axi.view_init(elev=45, azim= 45)
NPOINTS = 40
RESAMPLE = 2
N_FADE = int(RESAMPLE*NPOINTS*0.5)
N_FADE = 20
N_SEGS = (NPOINTS-1)*(RESAMPLE-1)
SHOW_POINTS_AXI_12 = True
SHOW_POINTS_AXI_34 = False
alpha = np.linspace(.5,1.5,NPOINTS)*np.pi
theta = np.linspace(.25,1.5,NPOINTS)*np.pi
rad = np.linspace(0,1,NPOINTS)
xs = rad*np.sin(theta)*np.cos(alpha)
ys = rad*np.sin(theta)*np.sin(alpha)
zs = rad*np.cos(theta)
MARKER = '.'
CMAP = plt.get_cmap('hsv')
COLORS = np.array([CMAP(i)[:-1] for i in np.linspace(0,1,NPOINTS)])
MARKER_COLOR = COLORS
N_SCATTER = (NPOINTS-1)*(RESAMPLE-1)+1
COLORS_LONG = np.array([CMAP(i)[:-1] for i in np.linspace(1/N_SCATTER,1,N_SCATTER)])
fig = plt.figure(figsize=(12,8),dpi=100)
ax1 = fig.add_subplot(221,projection='3d')
segs, colors = colored_line_segments(xs,ys,zs,color=COLORS,mid_colors=True)
if SHOW_POINTS_AXI_12: ax1.scatter(xs,ys,zs,marker=MARKER,color=COLORS)
ax1.add_collection(lc3d(segs, colors=colors))
ax2 = fig.add_subplot(222, projection='3d', sharex=ax1, sharey=ax1)
segs, colors, hiResData = segmented_resample(xs,ys,zs,color=COLORS,n_resample=RESAMPLE)
if SHOW_POINTS_AXI_12: ax2.scatter(hiResData[0],hiResData[1],hiResData[2],marker=MARKER,color=COLORS_LONG)
ax2.add_collection(lc3d(segs, colors=colors))
ax3 = fig.add_subplot(223,projection='3d', sharex=ax1, sharey=ax1)
segs, colors, hiResData = faded_segment_resample(xs,ys,zs,color=COLORS,fade_len=RESAMPLE*NPOINTS,n_resample=RESAMPLE,direction='Head')
if SHOW_POINTS_AXI_34: ax3.scatter(hiResData[0],hiResData[1],hiResData[2],marker=MARKER,color=COLORS_LONG)
ax3.add_collection(lc3d(segs, colors=colors))
ax4 = fig.add_subplot(224,projection='3d', sharex=ax1, sharey=ax1)
segs, colors, hiResData = faded_segment_resample(xs,ys,zs,color=COLORS,fade_len=N_FADE,n_resample=RESAMPLE,direction='Head')
if SHOW_POINTS_AXI_34: ax4.scatter(hiResData[0],hiResData[1],hiResData[2],marker=MARKER,color=COLORS_LONG)
ax4.add_collection(lc3d(segs, colors=colors))
labels = ('Original Data',
'Original Data - Resampled',
'Resampled - w/Full length fade',
'Resampled - w/{} point fade'.format(N_FADE) )
for ax,label in zip((ax1,ax2,ax3,ax4),labels):
set_view(ax)
ax.text(.6,-.6,1.55,label)
fig.savefig('3d_fadeSegmentedColorLine.png')
plt.show()
if __name__ == "__main__":
import matplotlib.pyplot as plt
test2d()
test3d()