一个matplotlib图中有多个绘图区域

3
在Python脚本中,我有一组2D的NumPy浮点数数组,假设为n1、n2、n3和n4。对于每个这样的数组,我都有两个整数值offset_i_x和offset_i_y(将i替换为1、2、3和4)。
目前,我能够使用以下脚本为一个NumPy数组创建图像:
   def make_img_from_data(data)
        fig = plt.imshow(data, vmin=-7, vmax=0)
        fig.set_cmap(cmap)
        fig.axes.get_xaxis().set_visible(False)
        fig.axes.get_yaxis().set_visible(False)
        filename = "my_image.png"
        plt.savefig(filename, bbox_inches='tight', pad_inches=0)
        plt.close()

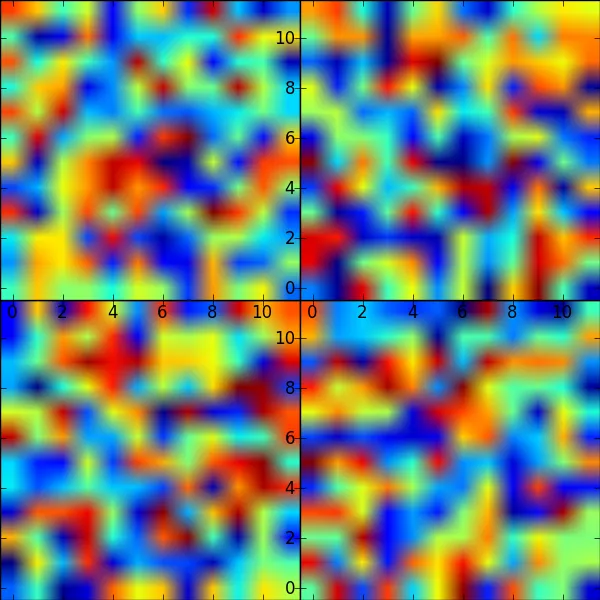
现在我想将每个数组视为更大图像中的一个瓷砖,并根据offset_i_x/y值放置,以最终写入单个图形而不是4个(在我的示例中)。我对MatplotLib和Python完全不熟悉。我该如何做呢?
此外,我注意到上面的脚本生成的图像大小为480x480像素,无论原始NumPy数组的大小如何。我该如何控制生成图像的大小?
谢谢
2个回答

4
你可能想考虑使用matplotlib.pyplot的add_axes函数。
下面是一个基于你想要实现的示例,但请注意,我选择了偏移值使示例正常工作。你需要找出如何将每个图像的偏移值转换为图形的分数。
import numpy as np
import matplotlib.pyplot as plt

def make_img_from_data(data, offset_xy, fig_number=1):
    fig.add_axes([0+offset_xy[0], 0+offset_xy[1], 0.5, 0.5])
    plt.imshow(data)

# creation of a dictionary with of 4 2D numpy array
# and corresponding offsets (x, y)

# offsets for the 4 2D numpy arrays
offset_a_x = 0
offset_a_y = 0
offset_b_x = 0.5
offset_b_y = 0
offset_c_x = 0
offset_c_y = 0.5
offset_d_x = 0.5
offset_d_y = 0.5

data_list = ['a', 'b', 'c', 'd']
offsets_list = [[offset_a_x, offset_a_y], [offset_b_x, offset_b_y],
                [offset_c_x, offset_c_y], [offset_d_x, offset_d_y]]

# dictionary of the data and offsets
data_dict = {f: [np.random.rand(12, 12), values] for f,values in zip(data_list, offsets_list)}

fig = plt.figure(1, figsize=(6,6))

for n in data_dict:
    make_img_from_data(data_dict[n][0], data_dict[n][1])

plt.show()

这将产生:

this result


0

如果我理解正确的话,您似乎正在寻找subplot。请查看缩略图库以获取示例。


网页内容由stack overflow 提供, 点击上面的
可以查看英文原文,
原文链接