我有一个使用以下代码生成的箱线图:
b.males <- c(6, 7, 8, 8, 8, 9, 10, 10, 11, 11, 12, 12, 12, 12, 13, 14, 15)
b.females <- c(14, 13, 12, 12, 11, 10, 10, 9, 9, 9, 9, 9, 8, 8, 8, 7, 7, 7, 7)
b.total<-c(b.males,b.females)
b.m<-data.frame(b.males)
b.f<-data.frame(b.females)
b.t<-data.frame(b.total)
myList<-list(b.m, b.f, b.t)
df<-melt(myList)
colnames(df) <- c("class","count")
plt<-ggplot(df, aes(x=class,y=count))+geom_boxplot()
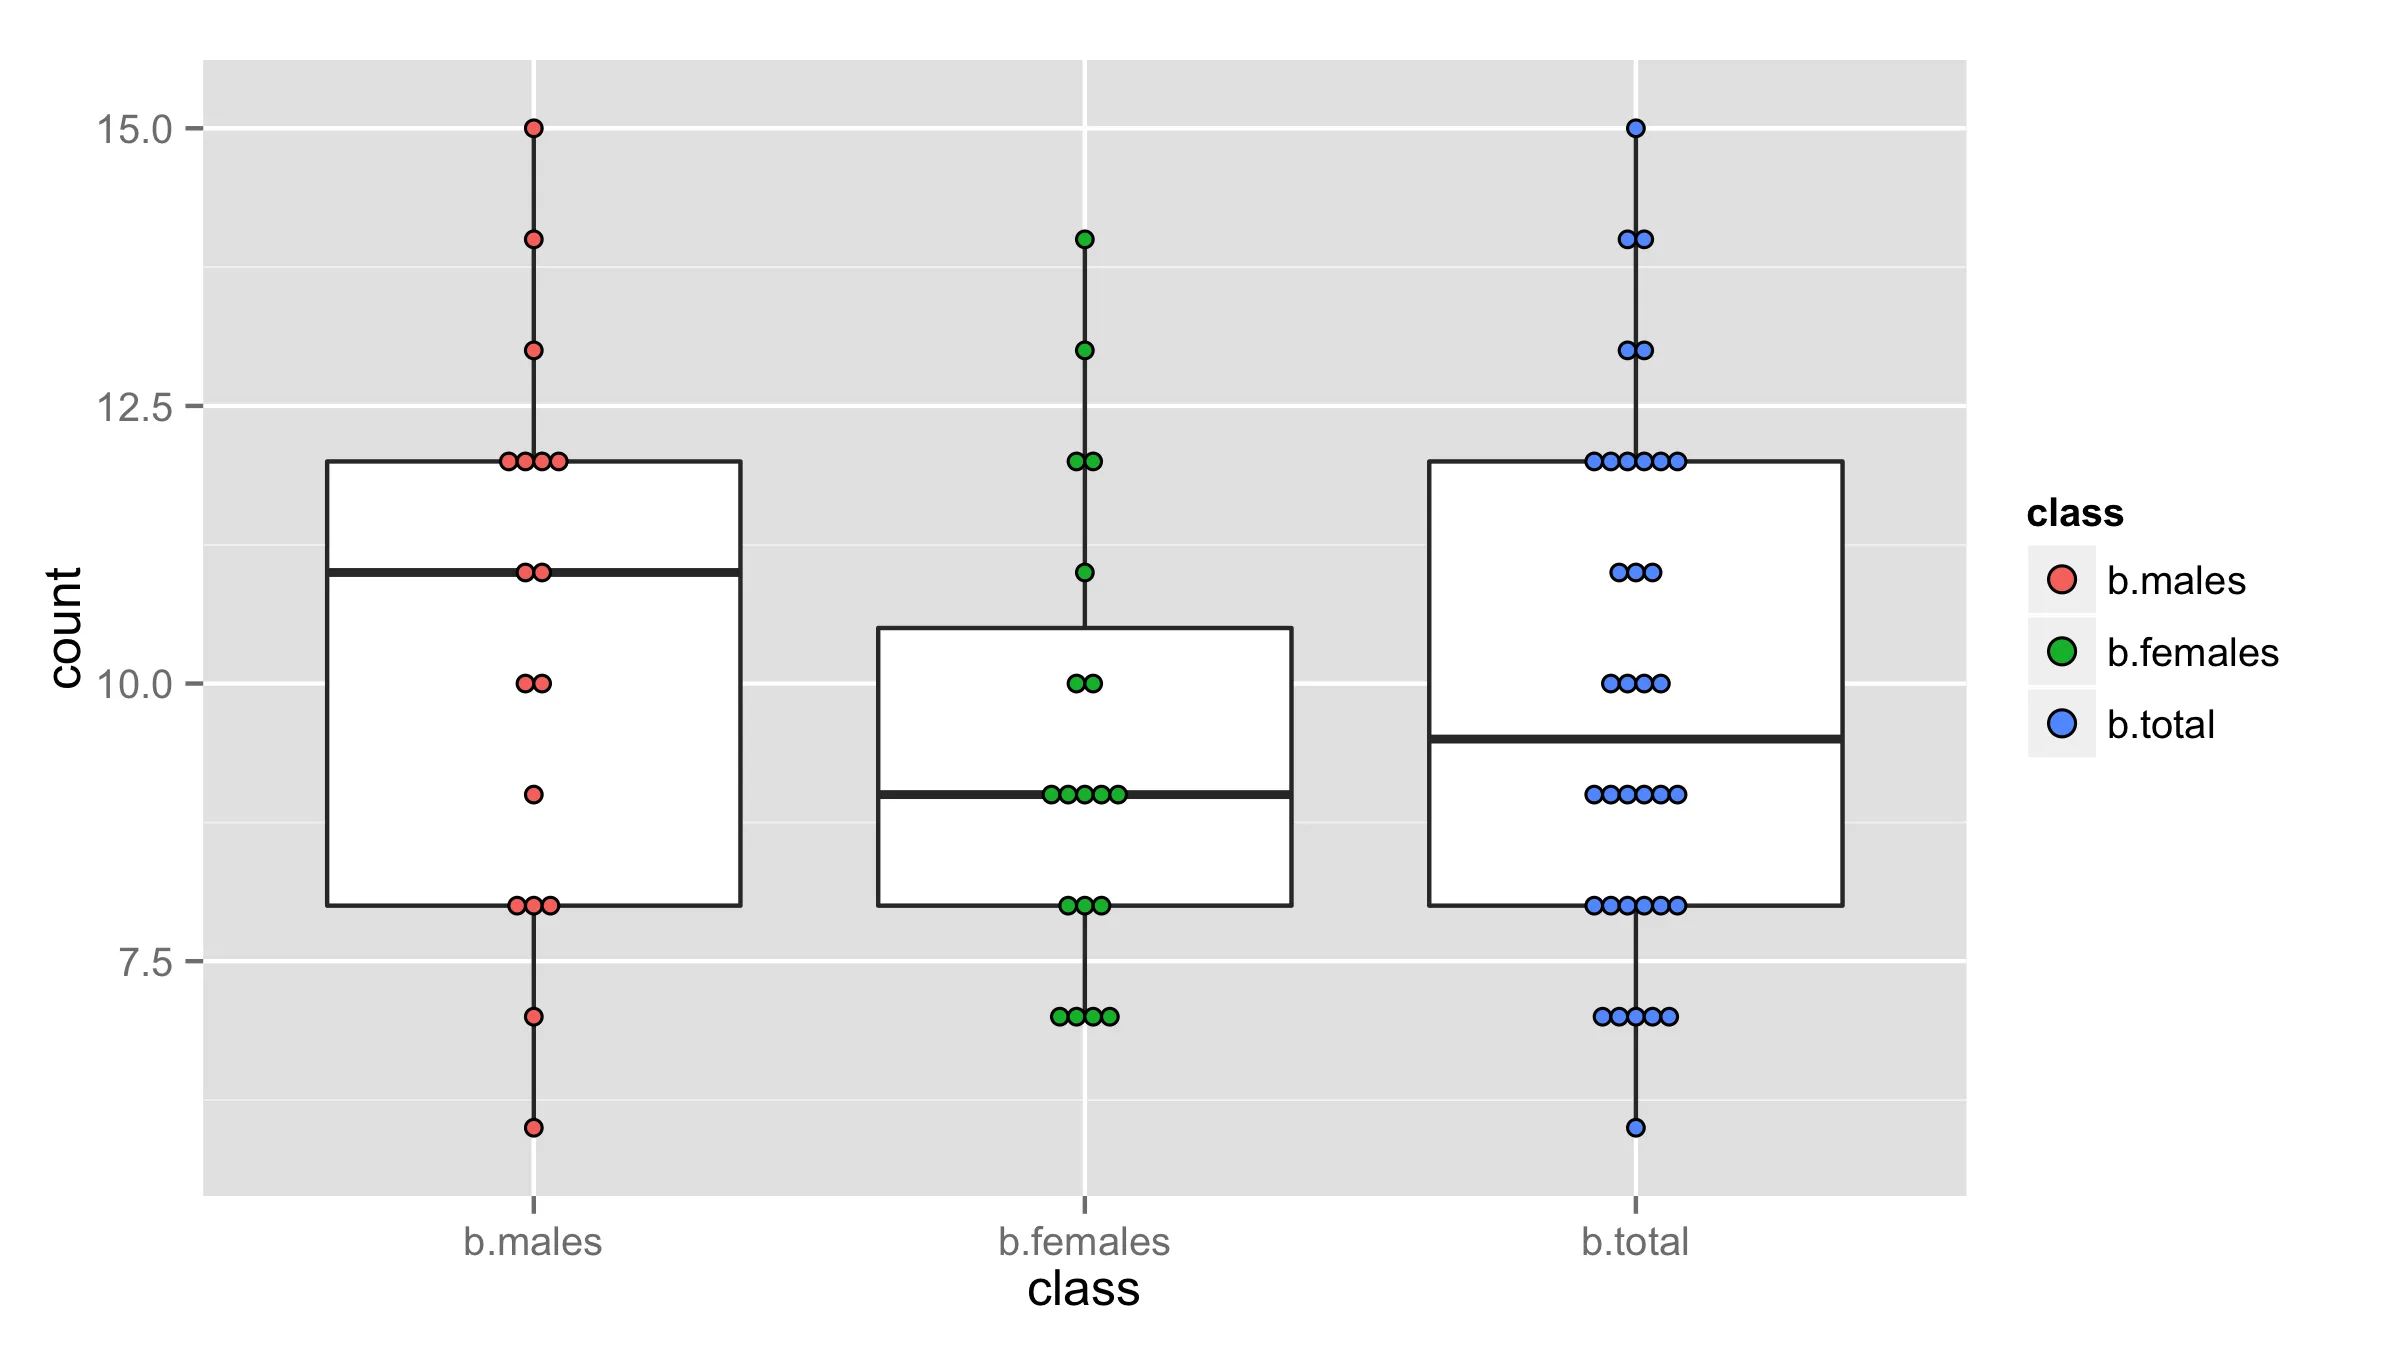
plt + geom_point(aes(x = as.numeric(class) + 0, colour=class))
我希望做的是,对于任何给定的y轴点,显示一行中的所有个体点。例如,对于b.males,我想看到在8处有三个点,其中中间的点正好在中心位置,其他两个点紧挨在其旁边。
我尝试了:
plt + geom_point(aes(x = as.numeric(class) + 0, colour=class)) +
      geom_jitter(position=position_jitter(width=.1, height=0))
但这并没有能够保持点之间的紧密联系。此外,在某些情况下,它会将多个点放在盒子中间的右侧或左侧,而不是均匀地分布它们,这并不符合我的要求。