我希望在由
例如:
给出情节:
ggplot2生成的箱线图中,每个框上方都有一个标签显示。例如:
#Example data
test = c("A", "A", "A", "A", "A", "A", "B", "B", "B", "B", "B", "B")
patient = c(1, 1, 2, 2, 3, 3, 1, 1, 2, 2, 3, 3)
result = c(5, 7, 2 ,4, 6, 7, 3, 5, 5, 6, 2 ,3)
data <- tibble(test, patient, result)
#Labels I want to include
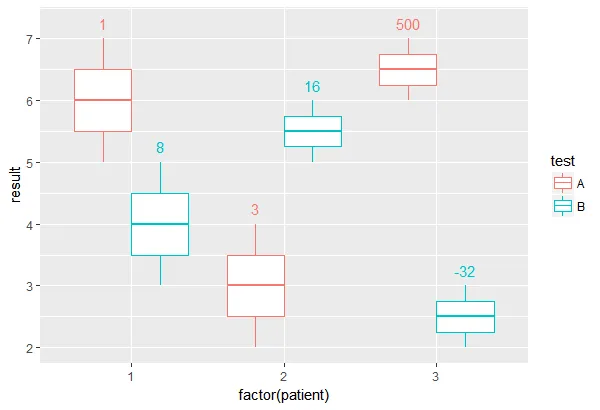
Alabs = c(1, 3, 500)
Blabs = c(8, 16, -32)
#Plot data
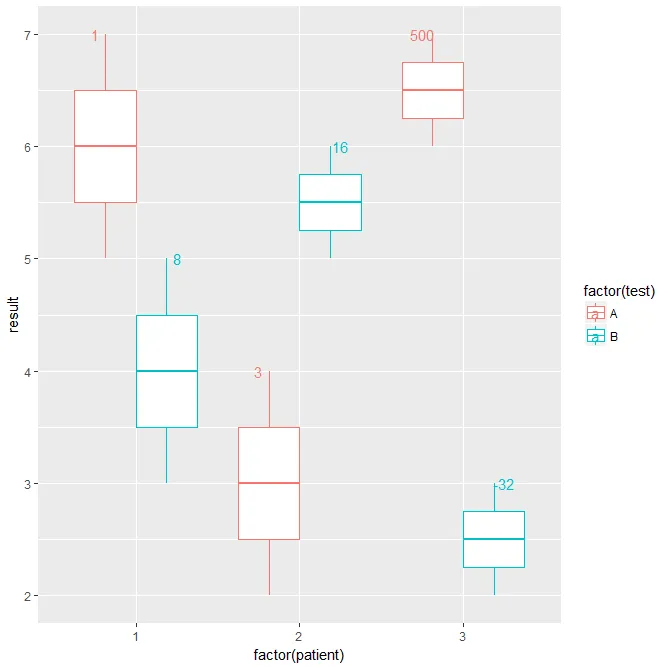
ggplot(data, aes(x = factor(patient), y = result, color = factor(test))) +
geom_boxplot(outlier.shape = 1)
给出情节:
Alabs 的第一个元素在红色框上方,第二个病人的 Alabs 的第二个元素在红色框上方,第一个病人的 Blabs 的第一个元素在蓝色框上方,以此类推。
我该如何实现?