我正在尝试创建一个ggplot图表,并添加我已经完成的相关性测试的结果。大概是这样的:
p+annotate("text",x=12.5,y=15.25,label=c(cor.test$estimate,cor.test$p.value))
无论我尝试什么,都会收到错误消息。有任何想法吗?
我正在尝试创建一个ggplot图表,并添加我已经完成的相关性测试的结果。大概是这样的:
p+annotate("text",x=12.5,y=15.25,label=c(cor.test$estimate,cor.test$p.value))
无论我尝试什么,都会收到错误消息。有任何想法吗?
我实际上使用ggpubr包中的stat_cor(),成功地向图表添加了统计数据细节。
library(ggpubr)
p+stat_cor(method="pearson")
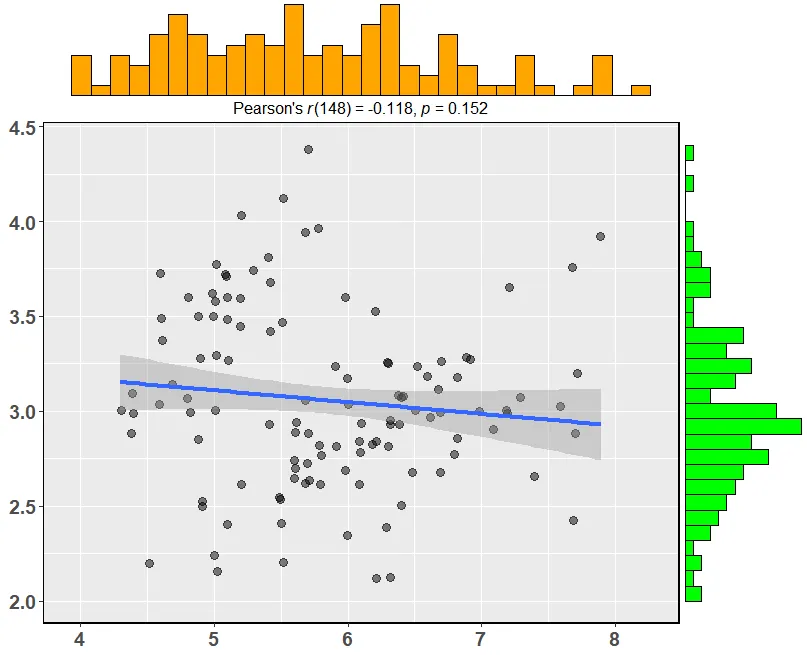
有一个正在开发中的软件包可以帮助您完成这个任务(ggstatsplot 已经在CRAN上发布)。
以下是创建相关性图表的示例:
ggstatsplot::ggscatterstats(data = iris, x = Sepal.Length, y = Sepal.Width)
type = 'spearman')或健壮的相关性测试(type = 'robust')获取结果):
ggplot,它将在图表上显示ttest(或corr test)的结果。 我现在使用行annotate(“text”,x = 1,y = 10,label ='atop(bold(“P-value = 0.286”))',cex = 7,parse = TRUE)。 唯一的问题是每次都必须手动更改该值。 我想在标签中插入ttest $ p.value,而不是数字。 - B.Shermeisterlabel='atop(bold(paste("P-value = ", ttest$p.value))))。 - Farid Huseynov