在已标记的图中更改点的颜色

9
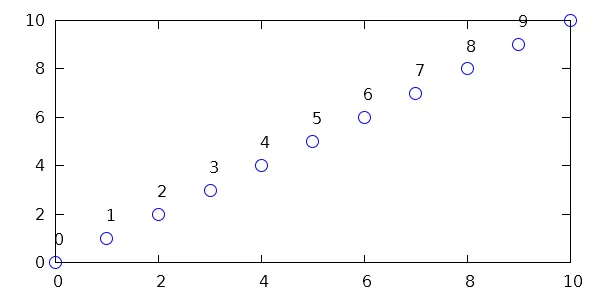
脚本可以正常工作,但是颜色没有任何变化:
plot '_numXY' using 2:3:(sprintf('%d', $1)) \
    with labels offset 0,1 point pointtype 6 ps 2 notitle lc rgb "blue"

这些点是黑色的。我想看到这些点变成蓝色
为什么使用lc rgb "blue"不起作用?

1个回答

13

如果labels绘图样式不紧随point选项后面,则忽略lc设置。在您的情况下,您必须将notitle放在最后。

plot '_numXY' using 2:3:(sprintf('%d', $1)) \
    with labels offset 0,1 point pointtype 6 ps 2 lc rgb "blue" notitle

作为演示例子:

set samples 11
set xrange [0:10]
plot '+' using 1:1:(sprintf('%d', $1)) \
    with labels offset 0,1 point pointtype 6 ps 2 lc rgb "blue" notitle

4.6.5的结果如下:

enter image description here


网页内容由stack overflow 提供, 点击上面的
可以查看英文原文,
原文链接