在最后两个函数之前,您应该添加一个绘图命令,可能需要在末尾加上unset multiplot。这应该可以解决问题。或者您想让单一图和多重图都可见吗?
plot sin(x) title "this should be a single plot"

set multiplot layout 2,2 title "Those are the multiplots"

set title "A!"
plot sin(x)

set title "B!"
plot cos(x) not

set title "C!"
plot tan(x) title "tan"

set title "D"
plot tan(0.5*x) not

unset multiplot
编辑:(手动设置尺寸、起点和边距)
### Multiplot layout
reset session
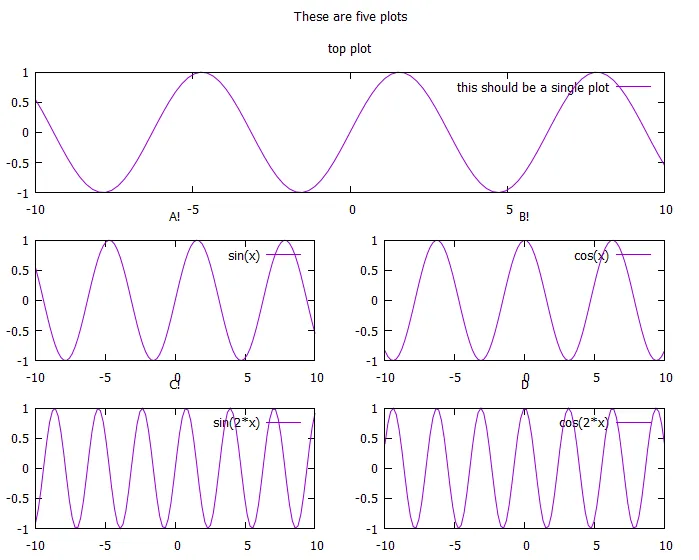
set multiplot title "These are five plots"
set ytics 0.5
set margins 5,5,2,8 # l,r,b,t
set size 1,0.5
set origin 0,0.6
set title "top plot"
plot sin(x) title "this should be a single plot"
set size 0.5,0.5
set origin 0,0.3
set title "A!"
plot sin(x)
set origin 0.5,0.3
set title "B!"
plot cos(x)
set origin 0,0
set title "C!"
plot sin(2*x)
set origin 0.5,0
set title "D"
plot cos(2*x)
unset multiplot
### end of code
结果:
补充:
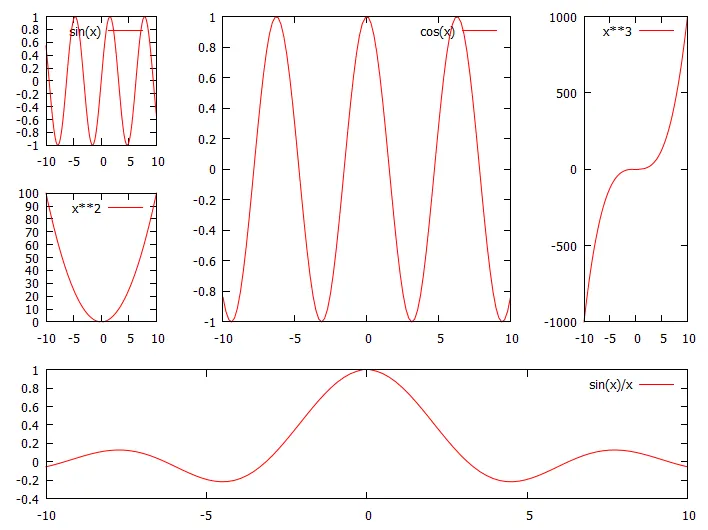
只是为了好玩,也许对你或其他人有用。只需几行代码,就可以轻松地将布局设置在一个矩阵中,其中包含在$Layout中存储的一些数字。希望这很容易理解。
代码:(编辑:简化)
reset session
$Layout <<EOD
1 1 1 1
1 2 2 2
1 4 2 1
2 1 1 1
3 1 1 4
EOD
stats $Layout u ($1+$3):($2+$4) nooutput
MPRows = STATS_max_x - 1
MPCols = STATS_max_y - 1
r(i) = word($Layout[i],1)
c(i) = word($Layout[i],2)
h(i) = word($Layout[i],3)
w(i) = word($Layout[i],4)
MPGridX = 1.0/MPCols
MPGridY = 1.0/MPRows
MPSizeX(i) = MPGridX*w(i)
MPSizeY(i) = MPGridY*h(i)
MPOriginX(i) = MPGridX*(c(i)-1)
MPOriginY(i) = 1-MPGridY*(r(i)+h(i)-1)
SetLayout = 'i=i+1; \
set origin MPOriginX(i), MPOriginY(i); \
set size MPSizeX(i) , MPSizeY(i)'
set multiplot
set linetype 1 lc rgb "red"
i=0
@SetLayout
plot sin(x)
@SetLayout
plot cos(x)
@SetLayout
plot x**3
@SetLayout
plot x**2
@SetLayout
plot sin(x)/x
unset multiplot
结果:
这段内容涉及IT技术方面的内容,无法简单解释。
- 一个宽的(2列)图
- 2x2的子图网格
- Panichi Pattumeros PapaCastoro