set style line 1 lc rgb 'blue' lt 1 lw 2 pt 7 ps 0.75 pi 5
或者在绘图命令中设置pt、ps和pi。
Gnuplot不会插入任何点。
我需要插入点来区分两条相同颜色的线。 它们必须是相同的颜色,因为它们属于同一“家族”。因此,我不能简单地改变颜色:(
我该怎么做呢?
谢谢
set style line 1 lc rgb 'blue' lt 1 lw 2 pt 7 ps 0.75 pi 5
或者在绘图命令中设置pt、ps和pi。
Gnuplot不会插入任何点。
我需要插入点来区分两条相同颜色的线。 它们必须是相同的颜色,因为它们属于同一“家族”。因此,我不能简单地改变颜色:(
我该怎么做呢?
谢谢
data.dat,该文件仅包含三个"集合"。1 2 3
2 1 1
3 3 3
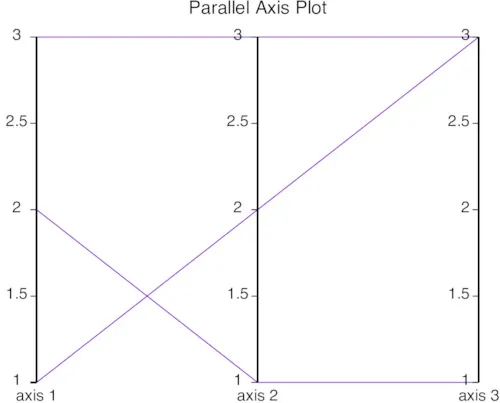
受默认的 Gnuplot 演示 parallel.dem 的启发,您可能会尝试使用类似于以下脚本 test.gpl 来实现此目标:
set title "Parallel Axis Plot" font ",15"

set terminal pdf
set output 'test.pdf'

set border 0
unset key
set xrange [] noextend
unset ytics

# use x-axis tic positions to label the axes
set xtics 1 format "axis %g" scale 0,0

# turn on axis tics for the parallel axes
set for [i=1:3] paxis i tics

plot 'data.dat' using 1:2:3 with parallel
 在这里,所有线条都是相同类型和颜色的,这会让人感到困惑。为了进行小幅升级,让我们按照以下方式修改输入数据文件:
1 2 3 5
2 1 1 6
3 3 3 7
并使用稍微不同的绘图命令
plot 'data.dat' using 1:2:3:4 with parallel lc var
pt 1之类的东西是不起作用的。此外,它会产生一个警告消息:"test.gpl", line 17: warning: No pointtype specifier allowed, here表明parallel样式根本不喜欢任何点说明。
cd ${HOME}

#prepare a sand box directory
mkdir gpl
cd gpl

#download the latest version
wget -O gnuplot_latest.tgz http://sourceforge.net/projects/gnuplot/files/latest/download?source=files
tar -xzvf gnuplot_latest.tgz

cd gnuplot-5.0.0
./configure --prefix=${HOME}/gpl/local
make && make install
现在,我们需要稍微操作一下存储在${HOME}/gpl/gnuplot-5.0.0/src中的一些源文件。也就是说,我们必须:
convince Gnuplot that the plotting style parallel likes points. For this it is sufficient to modify line 114 in gp_types.h and replace
PARALLELPLOT = 32*PLOT_STYLE_BITS + PLOT_STYLE_HAS_LINE
with
PARALLELPLOT = 32*PLOT_STYLE_BITS + PLOT_STYLE_HAS_LINE + PLOT_STYLE_HAS_POINT
introduce the ability to plot points within the parallel style. To this end, one has to locate the function plot_parallel in file graphics.c. By default it looks like this:
static void
plot_parallel(struct curve_points *plot)
{
    int i, j;
    int x0, y0, x1, y1;

    for (i = 0; i < plot->p_count; i++) {

    /* rgb variable  -  color read from data column */
    check_for_variable_color(plot, &plot->varcolor[i]);

    x0 = map_x(1.0);
    y0 = AXIS_MAP(PARALLEL_AXES+0, plot->z_n[0][i]);
    for (j = 1; j < plot->n_par_axes; j++) {
        x1 = map_x((double)(j+1));
        y1 = AXIS_MAP(PARALLEL_AXES+j, plot->z_n[j][i]);
        draw_clip_line(x0, y0, x1, y1);
        x0 = x1;
        y0 = y1;
    }

    }
}
Let's pimp it up a little bit:
static void
plot_parallel(struct curve_points *plot)
{
    int i, j;
    int x0, y0, x1, y1;

    int point_type;
    struct termentry *t = term;

    for (i = 0; i < plot->p_count; i++) {

    /* rgb variable  -  color read from data column */
    check_for_variable_color(plot, &plot->varcolor[i]);
    point_type = plot->varcolor?((int)plot->varcolor[i]-1):plot->lp_properties.p_type;

    x0 = map_x(1.0);
    y0 = AXIS_MAP(PARALLEL_AXES+0, plot->z_n[0][i]);

   (*t->pointsize)(plot->lp_properties.p_size);
   (*t->point)(x0, y0, point_type);

    for (j = 1; j < plot->n_par_axes; j++) {
        x1 = map_x((double)(j+1));
        y1 = AXIS_MAP(PARALLEL_AXES+j, plot->z_n[j][i]);
        draw_clip_line(x0, y0, x1, y1);
        (*t->point)(x1, y1, point_type);
        x0 = x1;
        y0 = y1;
    }

    }
}
and that's it! Now compile Gnuplot again with make && make install (invoked from directory ${HOME}/gpl/gnuplot-5.0.0). The output generated with ${HOME}/gpl/local/bin/gnuplot ${HOME}/gpl/test.gpl (using plotting command plot 'data.dat' using 1:2:3:4 with parallel lc var ps 1.5) should resemble this:
gp_types.h ensured that the point size specification ps 3 used in the final plot is not ignored (and is accessible in the plot_parallel function)plot_parallel function, we need to introduce a pointer to the global terminal variable, i.e., struct termentry *t = term;. This is then used later for the actual plotting of points.in the for loop which iterates over individual lines in the input data file, we determine the corresponding point type with
`point_type = plot->varcolor?((int)plot->varcolor[i]-1):plot->lp_properties.p_type;`
This ensures that if we don't use lc var then the point type is determined by pt (or default). If lc var is active, the point type is taken from the corresponding data column in the input data file.
(*t->pointsize)(plot->lp_properties.p_size); sets the desired point size specified with ps (or default).(*t->point)(x0, y0, point_type); augment individual line segments with the points.