我有一个数据文件,其中前两列是 x 和 y 值,第三列是表示点类型(符号)的数字。如何绘制具有不同符号的数据点?
3个回答
4
很遗憾,使用原始的GNUPLOT没有办法自动设置绘图点的位置,基于列值。
然而,有一种方法可以通过为每个数据系列设置线条样式来解决这个问题,并根据定义的样式绘制数值:
set style line 1 lc rgb 'red' pt 7 #Circle
set style line 2 lc rgb 'blue' pt 5 #Square
请记住,pt后面的数字是点的类型。
然后,你只需要绘制图表(假设"data.txt"中的数据按ColX、ColY和Col3排序):
plot  "data.txt" using 1:2 title 'Y Axis' with points ls 1, \
"data.txt" using 1:3 title 'Y Axis' with points ls 2
在此处尝试使用此数据(在“数据”部分中,还请注意第3列“符号”未使用,主要是为了说明目的):
# This file is called   force.dat
# Force-Deflection data for a beam and a bar
# Deflection    Col-Force       Symbol
0.000              0              5
0.001            104             5
0.002            202            7
0.003            298            7
在绘图脚本标题中:
set key inside bottom right
set xlabel 'Deflection (m)'
set ylabel 'Force (kN)'
set title 'Some Data'
set style line 1 lc rgb 'red' pt 7
set style line 2 lc rgb 'blue' pt 5
plot  "data.txt" using 1:2 title 'Col-Force' with points ls 1, \
"data.txt" using 1:3 title 'Beam-Force' with points ls 2
一条需要注意的限制是,您必须重新配置数据输入源。
参考资料:
- jrd1
1
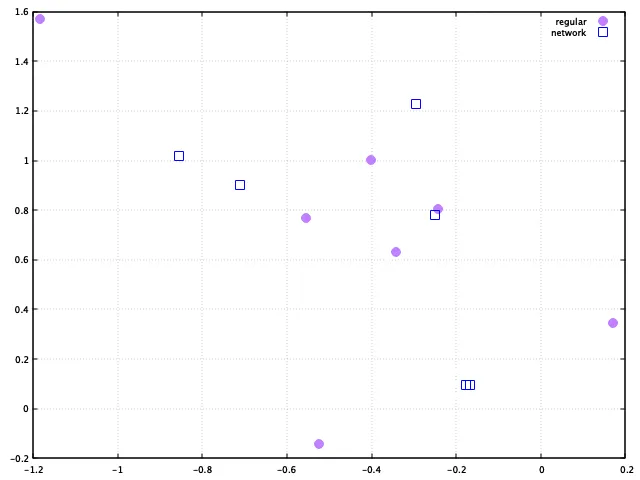
这里有一个可能的解决方案(从 gnuplot conditional plotting with if简单推导而来),只要您没有处理数十个不同符号,就可以使用它。假设我想在坐标系中绘制2D点。我只有两个符号,我在数据文件的最后一列任意地用0和1表示它们:
为了实现我想要的,我只需使用条件语句绘制文件。使用未定义值,如
这里是结果:
0 -0.29450470209121704 1.2279523611068726 1
1 -0.4006965458393097 1.0025811195373535 0
2 -0.7109975814819336 0.9022682905197144 1
3 -0.8540692329406738 1.0190201997756958 1
4 -0.5559651851654053 0.7677079439163208 0
5 -1.1831613779067993 1.5692367553710938 0
6 -0.24254602193832397 0.8055955171585083 0
7 -0.3412654995918274 0.6301406025886536 0
8 -0.25005266070365906 0.7788659334182739 1
9 -0.16853423416614532 0.09659398347139359 1
10 0.169997438788414 0.3473801910877228 0
11 -0.5252010226249695 -0.1398928463459015 0
12 -0.17566296458244324 0.09505800902843475 1
为了实现我想要的,我只需使用条件语句绘制文件。使用未定义值,如
1/0将导致不绘制给定点:# Set styles
REG_PTS = 'pointtype 7 pointsize 1.5 linecolor rgb "purple"'
NET_PTS = 'pointtype 4 pointsize 1.5 linecolor rgb "blue"'
set grid
# Plot each category with its own style
plot "data_file" u 2:($4 == 0 ? $3 : 1/0) title "regular" @REG_PTS, \
"data_file" u 2:($4 == 1 ? $3 : 1/0) title "network" @NET_PTS
这里是结果:
- Scrimbibete
0
变量pointype(pt variable)是在gnuplot 5.2.0(2017年9月)之后引入的(我猜的)(请检查help points)。
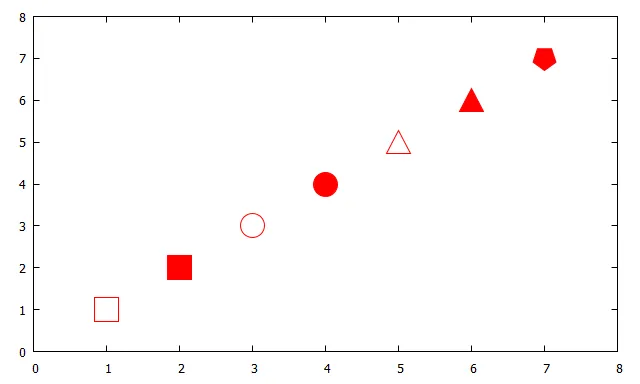
回顾一下,对于那些仍在使用早期版本的人来说,另一个(笨拙的)解决方案如下。
数据:
1   1.0   4    # empty  square
2   2.0   5    # filled square
3   3.0   6    # empty  circle
4   4.0   7    # filled circle
5   5.0   8    # empty  triangle up
6   6.0   9    # filled triangle down
7   7.0  15    # filled pentagon (cross in gnuplot 4.6 to 5.0)
脚本:(适用于gnuplot>=4.6.0,2012年3月以后的版本;但自5.2.0版本起不再需要)
### variable pointtype for gnuplot>=4.6
reset

FILE = 'SO23707979.dat'

set key noautotitle
set offsets 1,1,1,1
set pointsize 4

stats FILE u 0 nooutput
N = STATS_records       # get the number of rows

p0=x1=y1=NaN
plot for [n=0:N-1 ] FILE u (x0=x1, x1=$1, x0):(y0=y1, y1=$2, y0):(p0=$3) \
     every ::n::n w p pt p0 lc rgb "red", \
     FILE u 1:2 every ::N-1::N-1 w p pt p0 lc rgb "red"
### end of script
结果:
- theozh
网页内容由stack overflow 提供, 点击上面的可以查看英文原文,
原文链接
原文链接