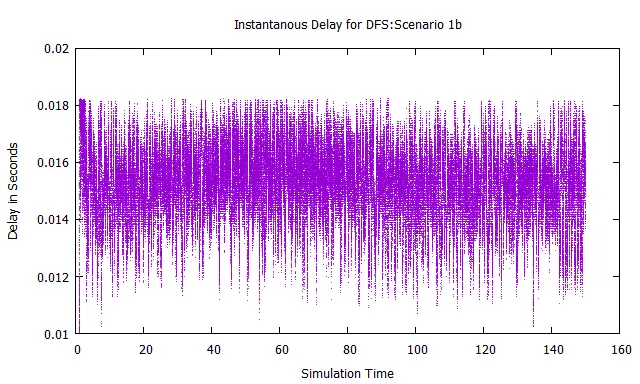
这里是一个仅使用gnuplot的解决方案,带有示例数据:
set table "test.data"
set samples 1000
plot rand(0)+sin(x)
unset table
你应该查看gnuplot演示页面以获取一个运行平均值。我打算将这个演示通用化,用动态构建函数的方式进行。这样可以更容易地改变包括在平均值中的点数。
这是脚本:
# number of points in moving average
n = 50
# initialize the variables
do for [i=1:n] {
eval(sprintf("back%d=0", i))
}
# build shift function (back_n = back_n-1, ..., back1=x)
shift = "("
do for [i=n:2:-1] {
shift = sprintf("%sback%d = back%d, ", shift, i, i-1)
}
shift = shift."back1 = x)"
# uncomment the next line for a check
# print shift
# build sum function (back1 + ... + backn)
sum = "(back1"
do for [i=2:n] {
sum = sprintf("%s+back%d", sum, i)
}
sum = sum.")"
# uncomment the next line for a check
# print sum
# define the functions like in the gnuplot demo
# use macro expansion for turning the strings into real functions
samples(x) = $0 > (n-1) ? n : ($0+1)
avg_n(x) = (shift_n(x), @sum/samples($0))
shift_n(x) = @shift
# the final plot command looks quite simple
set terminal pngcairo
set output "moving_average.png"
plot "test.data" using 1:2 w l notitle, \
"test.data" using 1:(avg_n($2)) w l lc rgb "red" lw 3 title "avg\\_".n
这是结果:
正如算法预期的那样,平均值滞后于数据点。也许50个数据点太多了。另外,可以考虑实现一个居中移动平均,但这超出了本问题的范围。 并且,我认为使用外部程序更加灵活 :)
# number of points in moving average
n = 5000
array A[n]
samples(x) = $0 > (n-1) ? n : int($0+1)
mod(x) = int(x) % n
avg_n(x) = (A[mod($0)+1]=x, (sum [i=1:samples($0)] A[i]) / samples($0))
对于gnuplot >=5.2来说,可能最有效的解决方案是使用类似@Franky_GT所提供解决方案的数组。
但是,它使用了伪列0(请参阅help pseudocolumns
)。如果您的数据中有一些空行,则$0
将被重置为0
,最终可能会搞乱你的平均值。
此解决方案使用索引t
来计算数据行数,并使用第二个数组X[]
(如果需要移动平均值)。数据点不必在x轴上等距离分布。
在开始时,没有足够的数据点进行N
点的中心平均,因此对于x值,它将使用每隔一个点和另一个点为NaN
,因此需要set datafile missing NaN
以在开始时绘制连续线。
代码:
### moving average over N points
reset session
# create some test data
set print $Data
y = 0
do for [i=1:5000] {
print sprintf("%g %g", i, y=y+rand(0)*2-1)
}
set print
# average over N values
N = 250
array Avg[N]
array X[N]
MovAvg(col) = (Avg[(t-1)%N+1]=column(col), n = t<N ? t : N, t=t+1, (sum [i=1:n] Avg[i])/n)
MovAvgCenterX(col) = (X[(t-1)%N+1]=column(col), n = t<N ? t%2 ? NaN : (t+1)/2 : ((t+1)-N/2)%N+1, n==n ? X[n] : NaN) # be aware: gnuplot does integer division here
set datafile missing NaN
plot $Data u 1:2 w l ti "Data", \
t=1 '' u 1:(MovAvg(2)) w l lc rgb "red" ti sprintf("Moving average over %d",N), \
t=1 '' u (MovAvgCenterX(1)):(MovAvg(2)) w l lw 2 lc rgb "green" ti sprintf("Moving average centered over %d",N)
### end of code
结果:
编辑
更新的问题是有关移动平均线的。
根据这个演示,您可以仅使用gnuplot来进行有限的操作。
但是,在我看来,使用像Python或Ruby这样的编程语言预处理数据并添加额外的列更加灵活,以满足您需要的任何类型的移动平均线。
下面是原始答案:
您可以使用fit
。似乎您想适应一个常数函数。就像这样:
f(x) = c
fit f(x) 'S1_delay_120_LT100_LU15_MU5.txt' using 1:2 every 5 via c
plot 'S1_delay_120_LT100_LU15_MU5.txt' using 1:2 every 5, \
f(x) with lines
set datafile commentschars "#@&"
Franky_GT的移动平均代码会导致这个错误:
unknown type in imag()
我希望这对任何人都有用。
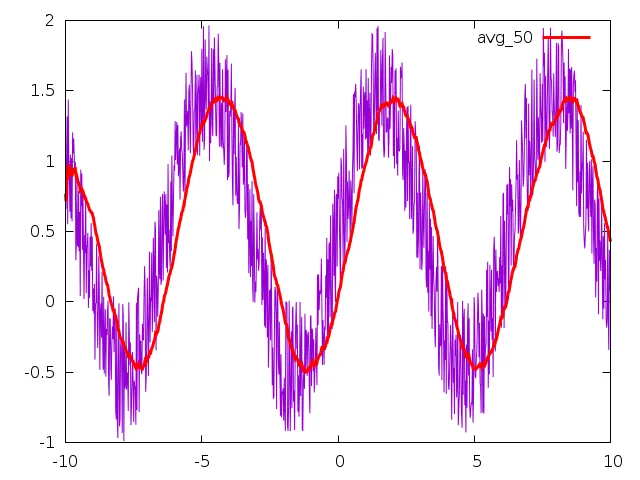
plot "test.data" using ($1-n/2):(avg_n($2))
重新调整平均曲线的中心位置。请注意,为了使符号“@”起作用,您可能需要在脚本顶部添加set macros
。 - mindriot