我希望代码可以对每个数据点的值求和而不是计数。
您可以使用 markerOptions() 将您的数据/统计信息传递给标记。
leaflet() %>%
  addTiles() %>%
    addMarkers(
      options = markerOptions(score = getScore(breweries91)),
      ...
    )
然后在JavaScript中使用
marker.options.score来检索它。
我想更多地控制气泡的大小,取决于值。
在下面的演示代码中,在javascript中查找代码let width = 4 + 2*Math.sqrt(grandTotal/1.5);进行调整以调整气泡半径。
... 非饼图标记的计数
对于R的Leaflet,初始化程序makeIcon、awesomeIcons和icons强制您创建和使用自定义图像。而且没有绕过它的办法。 addCircleMarkers看起来对我们有用,但它不允许您设置文本。
我们可以在clusterOptions中使用singleMarkerMode。使用它,我们可以将单个标记作为大小为1的簇,并使用我们已编码的iconCreateFunction JavaScript代码呈现它们:
leaflet() %>%
  addTiles() %>%
   addMarkers(
             ...
             clusterOptions = markerClusterOptions(
               singleMarkerMode = TRUE,
               iconCreateFunction = JS(jsscript3)
             )
  )
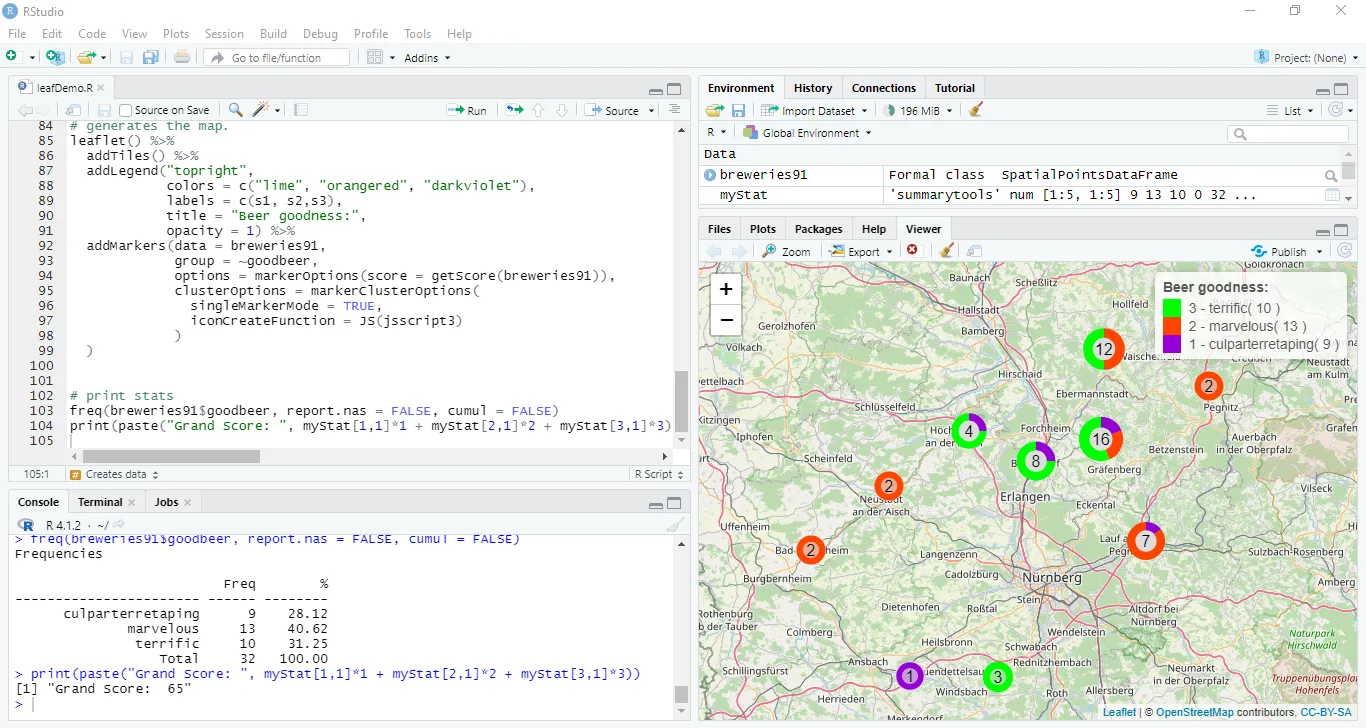
1) 演示: 在您的代码中没有可用于标记的数字数据。因此,我使用getScore函数创建了一个映射,用于分数值:
terrific          => 3
marvelous         => 2
culparterretaping => 1
使用summarytools添加了带有摘要的图例。
以下是最终代码:
install.packages("pacman")
require(pacman)
pacman::p_load(pacman, dplyr, leaflet, summarytools)
data("breweries91",package="leaflet")
cat('\014')
breweries91$goodbeer<-sample(as.factor(c("terrific","marvelous","culparterretaping")),nrow(breweries91),replace=T)
names(breweries91)
joliepalette<-c("darkviolet","orangered","lime")[1:nlevels(breweries91$goodbeer)]
getColor <- function(breweries91) {joliepalette[breweries91$goodbeer]}
jolieValue<-c(1L,2L,3L)[1:nlevels(breweries91$goodbeer)]
getScore <- function(breweries91) {jolieValue[breweries91$goodbeer]}
jsscript3<-paste0(
"function(cluster) {
const groups= [",paste("'",levels(breweries91$goodbeer),"'",sep="",collapse=","),"];
const colors= {
groups: [",paste("'",joliepalette,"'",sep="",collapse=","),"],
center:'#ddd',
text:'black'
};
const markers= cluster.getAllChildMarkers();
let grandTotal = markers.reduce((a,b)=> +a + +b.options.score, 0);
const proportions= groups.map(group => markers
.filter(marker => marker.options.group === group)
.reduce((a,b)=> +a + +b.options.score, 0) / grandTotal);
function sum(arr, first= 0, last) {
return arr.slice(first, last).reduce((total, curr) => total+curr, 0);
}
const cumulativeProportions= proportions.map((val, i, arr) => sum(arr, 0, i+1));
cumulativeProportions.unshift(0);
let width = 4 + 2*Math.sqrt(grandTotal/1.5);
width = width > 16? 16: width;
let radius= 10 + (width/2);
radius += (grandTotal < 40)? grandTotal/10 : 4;
const arcs= cumulativeProportions.map((prop, i) => { return {
x : radius*Math.sin(2*Math.PI*prop),
y : -radius*Math.cos(2*Math.PI*prop),
long: proportions[i-1] >.5 ? 1 : 0
}});
const paths= proportions.map((prop, i) => {
if (prop === 0) return '';
else if (prop === 1) return `<circle cx='0' cy='0' r='${radius-2}' fill-opacity='0.3' stroke-opacity fill='${colors.groups[i]}' stroke='${colors.groups[i]}' stroke-width='${width}' stroke-alignment='center' stroke-linecap='butt' />`;
else return `<path d='M ${arcs[i].x} ${arcs[i].y} A ${radius} ${radius} 0 ${arcs[i+1].long} 1 ${arcs[i+1].x} ${arcs[i+1].y}' fill='none' stroke='${colors.groups[i]}' stroke-width='${width}' stroke-alignment='center' stroke-linecap='butt' />`
});
return new L.DivIcon({
html: `
<svg width='60' height='60' viewBox='-30 -30 60 60' style='width: 60px; height: 60px; position: relative; top: -24px; left: -24px;' >
<circle cx='0' cy='0' r='15' stroke='none' fill='${colors.center}' />
${paths.join('')}
<text x='0' y='0' dominant-baseline='central' text-anchor='middle' fill='${colors.text}' font-size='16'>${grandTotal}</text>
</svg>
`,
className: 'marker-cluster'
});
}")
myStat <- freq(breweries91$goodbeer, report.nas = FALSE, cumul = FALSE)
s1 <- paste("3 - terrific(",myStat[3,1],")")
s2 <- paste("2 - marvelous(",myStat[2,1],")")
s3 <- paste("1 - culparterretaping(", myStat[1,1],")")
leaflet() %>%
addTiles() %>%
addLegend("topright",
colors = c("lime", "orangered", "darkviolet"),
labels = c(s1, s2,s3),
title = "Beer goodness:",
opacity = 1) %>%
addMarkers(data = breweries91,
group = ~goodbeer,
options = markerOptions(score = getScore(breweries91)),
clusterOptions = markerClusterOptions(
singleMarkerMode = TRUE,
iconCreateFunction = JS(jsscript3)
)
)
freq(breweries91$goodbeer, report.nas = FALSE, cumul = FALSE)
print(paste("Grand Score: ", myStat[1,1]*1 + myStat[2,1]*2 + myStat[3,1]*3))
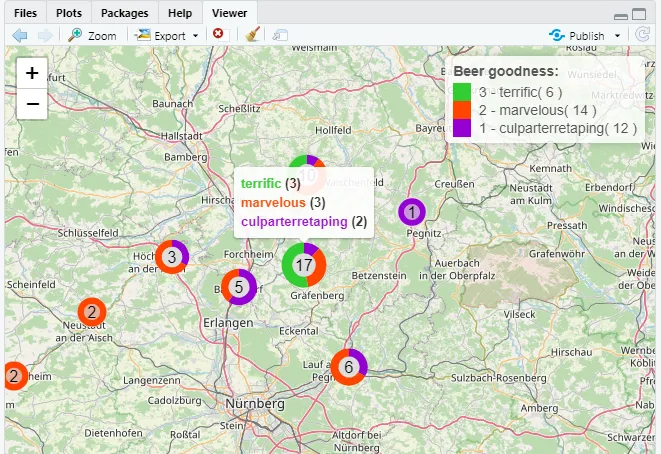
2) 在集群对象中共享数据:每个标记都可以看到其弹出窗口对象和弹出窗口选项。因此,您可以从标记对象本身进行弹出窗口操作,在我们的例子中是从iconCreateFunction中进行操作。
MarkerCluster库没有提供为集群标记添加标签或弹出窗口的方法。当您单击集群图标时,它会缩放并且不显示弹出窗口。作为解决方法,我们可以禁用单击缩放,并显示自定义工具提示/弹出窗口:
# Title: R Leaflet custom summing marker demo
# Load packages ##################
install.packages("pacman")
require(pacman)
pacman::p_load(pacman, dplyr, leaflet, summarytools)
# Creates data ##################
data("breweries91",package="leaflet")
cat('\014') # ctrl+L
#head(breweries91, 2L)
breweries91$goodbeer<-sample(as.factor(c("terrific","marvelous","culparterretaping")),nrow(breweries91),replace=T)
names(breweries91)
# Colors
joliepalette<-c("darkviolet","orangered","limegreen")[1:nlevels(breweries91$goodbeer)]
getColor <- function(breweries91) {joliepalette[breweries91$goodbeer]}
# Score
jolieValue<-c(1L,2L,3L)[1:nlevels(breweries91$goodbeer)]
getScore <- function(breweries91) {jolieValue[breweries91$goodbeer]}
# iconCreateFunction Javascript
jsscript3<-paste0(
"function(cluster) {
const groups= [",paste("'",levels(breweries91$goodbeer),"'",sep="",collapse=","),"];
const colors= {
groups: [",paste("'",joliepalette,"'",sep="",collapse=","),"],
center:'#ddd',
text:'black'
};
const markers= cluster.getAllChildMarkers();
let grandTotal = markers.reduce((a,b)=> +a + +b.options.score, 0);
const proportions= groups.map(group => markers
.filter(marker => marker.options.group === group)
.reduce((a,b)=> +a + +b.options.score, 0) / grandTotal);
function sum(arr, first= 0, last) {
return arr.slice(first, last).reduce((total, curr) => total+curr, 0);
}
const cumulativeProportions= proportions.map((val, i, arr) => sum(arr, 0, i+1));
cumulativeProportions.unshift(0);
let width = 4 + 2*Math.sqrt(grandTotal/1.5);
width = width > 16? 16: width;
let radius= 10 + (width/2);
radius += (grandTotal < 40)? grandTotal/10 : 4;
const arcs= cumulativeProportions.map((prop, i) => { return {
x : radius*Math.sin(2*Math.PI*prop),
y : -radius*Math.cos(2*Math.PI*prop),
long: proportions[i-1] >.5 ? 1 : 0
}});
const paths= proportions.map((prop, i) => {
if (prop === 0) return '';
else if (prop === 1) return `<circle cx='0' cy='0' r='${radius-2}' fill-opacity='0.3' stroke-opacity fill='${colors.groups[i]}' stroke='${colors.groups[i]}' stroke-width='${width}' stroke-alignment='center' stroke-linecap='butt' />`;
else return `<path d='M ${arcs[i].x} ${arcs[i].y} A ${radius} ${radius} 0 ${arcs[i+1].long} 1 ${arcs[i+1].x} ${arcs[i+1].y}' fill='none' stroke='${colors.groups[i]}' stroke-width='${width}' stroke-alignment='center' stroke-linecap='butt' />`
});
let icon = new L.DivIcon({
html: `
<svg width='60' height='60' viewBox='-30 -30 60 60' style='width: 60px; height: 60px; position: relative; top: -24px; left: -24px;' >
<circle cx='0' cy='0' r='15' stroke='none' fill='${colors.center}' />
${paths.join('')}
<text x='0' y='0' dominant-baseline='central' text-anchor='middle' fill='${colors.text}' font-size='16'>${grandTotal}</text>
</svg>
`,
className: 'marker-cluster'
});
// make custom popup for the cluster
if(cluster._map){
let counts = groups.map(group => markers
.filter(marker => marker.options.group === group).length);
let content = `<span style='color:limegreen'>${groups[2]}</span> <span>(${counts[2]})</span><br>`;
content += `<span style='color:orangered'>${groups[1]}</span> <span>(${counts[1]})</span><br>`;
content += `<span style='color:darkviolet'>${groups[0]}</span> <span>(${counts[0]})</span><br>`;
content = `<div style='font-size:13px;font-weight:bold'>` + content + `</div>`;
cluster.on('click', function (a) {
let tt = L.tooltip({permanent:false, direction:'top', offset: L.point(0, -width*2)});
tt.setContent( content );
tt.setLatLng(cluster.getLatLng());
tt.addTo(cluster._map);
});
}
return icon;
}")
# gather stats for legend
myStat <- freq(breweries91$goodbeer, report.nas = FALSE, cumul = FALSE)
s1 <- paste("3 - terrific(",myStat[3,1],")")
s2 <- paste("2 - marvelous(",myStat[2,1],")")
s3 <- paste("1 - culparterretaping(", myStat[1,1],")")
# generates the map.
leaflet() %>%
addTiles() %>%
addLegend("topright",
colors = c("limegreen", "orangered", "darkviolet"),
labels = c(s1, s2,s3),
title = "Beer goodness:",
opacity = 1) %>%
addMarkers(data = breweries91,
group = ~goodbeer,
popup = paste("", breweries91$goodbeer),
popupOptions = popupOptions(maxWidth = 1000, closeOnClick = TRUE),
options = markerOptions(score = getScore(breweries91)),
clusterOptions = markerClusterOptions(
singleMarkerMode = TRUE,
zoomToBoundsOnClick = FALSE,
iconCreateFunction = JS(jsscript3)
)
)
# print stats
cat('\014') # ctrl+L
freq(breweries91$goodbeer, report.nas = FALSE, cumul = FALSE)
print(paste("Grand Score: ", myStat[1,1]*1 + myStat[2,1]*2 + myStat[3,1]*3))
这里我们使用常规方法在各个标记上显示弹出窗口:
leaflet() %>%
  addTiles() %>%
    addMarkers(data = breweries91,
             popup = paste("", breweries91$goodbeer),
             popupOptions = popupOptions(maxWidth = 1000, closeOnClick = TRUE),
    ...)
iconCreateFunction中进行的特殊处理仅适用于群集标记。
在最坏的情况下,如果您想在标记/群集之间共享数据,则可以在cluster._map属性中找到Leaflet 地图对象。或者,您可以将数据附加到javascript window对象上,并在整个javascript代码中随时访问它。
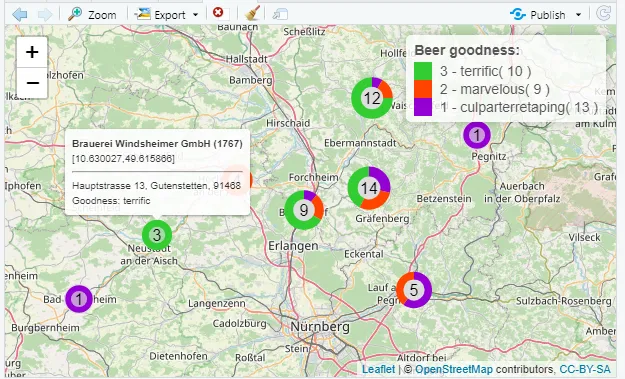
3) 将整行数据传递给 Leaflet: 我们可以使用以下方式将整行数据传递给 Leaflet:
options = markerOptions(row_data = setNames(split(breweries91,
                                             seq(nrow(breweries91))),
                                              rownames(breweries91)))
现在,我们可以在弹出窗口中添加许多内容,包括坐标:
# Title: R Leaflet custom summing marker demo
# Load packages ##################
install.packages("pacman")
require(pacman)
pacman::p_load(pacman, dplyr, leaflet, summarytools)
# Creates data ##################
data("breweries91",package="leaflet")
cat('\014') # ctrl+L
#head(breweries91, 2L)
breweries91$goodbeer<-sample(as.factor(c("terrific","marvelous","culparterretaping")),nrow(breweries91),replace=T)
breweries91$score<-ifelse(breweries91$goodbeer == "terrific",3L,
ifelse(breweries91$goodbeer == "marvelous",2L,
ifelse(breweries91$goodbeer == "culparterretaping",1L,0L)))
names(breweries91)
# Colors
joliepalette<-c("darkviolet","orangered","limegreen")[1:nlevels(breweries91$goodbeer)]
getColor <- function(breweries91) {joliepalette[breweries91$goodbeer]}
# iconCreateFunction Javascript
jsscript3<-paste0(
"function(cluster) {
const groups= [",paste("'",levels(breweries91$goodbeer),"'",sep="",collapse=","),"];
const colors= {
groups: [",paste("'",joliepalette,"'",sep="",collapse=","),"],
center:'#ddd',
text:'black'
};
const markers= cluster.getAllChildMarkers();
//console.log(markers[0]);
let grandTotal = markers.reduce((a,b)=> +a + +b.options.row_data.data.score, 0);
const proportions= groups.map(group => markers
.filter(marker => marker.options.group === group)
.reduce((a,b)=> +a + +b.options.row_data.data.score, 0) / grandTotal);
function sum(arr, first= 0, last) {
return arr.slice(first, last).reduce((total, curr) => total+curr, 0);
}
const cumulativeProportions= proportions.map((val, i, arr) => sum(arr, 0, i+1));
cumulativeProportions.unshift(0);
let width = 4 + 2*Math.sqrt(grandTotal/1.5);
width = width > 16? 16: width;
let radius= 10 + (width/2);
radius += (grandTotal < 40)? grandTotal/10 : 4;
const arcs= cumulativeProportions.map((prop, i) => { return {
x : radius*Math.sin(2*Math.PI*prop),
y : -radius*Math.cos(2*Math.PI*prop),
long: proportions[i-1] >.5 ? 1 : 0
}});
const paths= proportions.map((prop, i) => {
if (prop === 0) return '';
else if (prop === 1) return `<circle cx='0' cy='0' r='${radius-2}' fill-opacity='0.3' stroke-opacity fill='${colors.groups[i]}' stroke='${colors.groups[i]}' stroke-width='${width}' stroke-alignment='center' stroke-linecap='butt' />`;
else return `<path d='M ${arcs[i].x} ${arcs[i].y} A ${radius} ${radius} 0 ${arcs[i+1].long} 1 ${arcs[i+1].x} ${arcs[i+1].y}' fill='none' stroke='${colors.groups[i]}' stroke-width='${width}' stroke-alignment='center' stroke-linecap='butt' />`
});
let icon = new L.DivIcon({
html: `
<svg width='60' height='60' viewBox='-30 -30 60 60' style='width: 60px; height: 60px; position: relative; top: -24px; left: -24px;' >
<circle cx='0' cy='0' r='15' stroke='none' fill='${colors.center}' />
${paths.join('')}
<text x='0' y='0' dominant-baseline='central' text-anchor='middle' fill='${colors.text}' font-size='16'>${grandTotal}</text>
</svg>
`,
className: 'marker-cluster'
});
// make custom popup for the cluster
let content ='popup';
if(cluster._map){ //if it's cluster
//console.log(cluster);
let counts = groups.map(group => markers
.filter(marker => marker.options.group === group).length);
content = `<span style='color:limegreen'>${groups[2]}</span> <span>(${counts[2]})</span><br>`;
content += `<span style='color:orangered'>${groups[1]}</span> <span>(${counts[1]})</span><br>`;
content += `<span style='color:darkviolet'>${groups[0]}</span> <span>(${counts[0]})</span><br>`;
content = `<div style='font-size:13px;font-weight:bold'>` + content + `</div>`;
} else{ //if it's single marker
//console.log(cluster.getAllChildMarkers());
cluster = cluster.getAllChildMarkers()[0];
//console.log(cluster);
let r = cluster.options.row_data;
let loc = r.coords;
r = r.data;
let address = r.address;
let name = `${r.brewery} (${r.founded})`;
content = `<span><strong>${name}</strong></span><br>`;
content += `<span style='margin-bottom:10px'>[${loc}]</span><hr>`;
content += `<span>${address}, ${r.village}, ${r.zipcode}</span><br>`;
content += `<span>Goodness: ${r.goodbeer}</span>`;
}
cluster.on('click', function (a) {
let tt = L.tooltip({permanent:false, direction:'top', offset: L.point(0, -width*2)});
tt.setContent( content );
tt.setLatLng(cluster.getLatLng());
tt.addTo(cluster._map);
});
return icon;
}")
# gather stats for legend
myStat <- freq(breweries91$goodbeer, report.nas = FALSE, cumul = FALSE)
s1 <- paste("3 - terrific(",myStat[3,1],")")
s2 <- paste("2 - marvelous(",myStat[2,1],")")
s3 <- paste("1 - culparterretaping(", myStat[1,1],")")
# generates the map.
leaflet() %>%
addTiles() %>%
addLegend("topright",
colors = c("limegreen", "orangered", "darkviolet"),
labels = c(s1, s2,s3),
title = "Beer goodness:",
opacity = 1) %>%
addMarkers(data = breweries91,
group = ~goodbeer,
popupOptions = popupOptions(maxWidth = 1000, closeOnClick = TRUE),
options = markerOptions(row_data = setNames(split(breweries91, seq(nrow(breweries91))), rownames(breweries91))),
clusterOptions = markerClusterOptions(
singleMarkerMode = TRUE,
zoomToBoundsOnClick = FALSE,
iconCreateFunction = JS(jsscript3)
)
)
# print stats
cat('\014') # ctrl+L
freq(breweries91$goodbeer, report.nas = FALSE, cumul = FALSE)
print(paste("Grand Score: ", myStat[1,1]*1 + myStat[2,1]*2 + myStat[3,1]*3))
为了参考,我提取了一个样本集群对象:集群对象Json。
使用这个对象,您可以查找集群对象中的属性以在javascript中使用。
console.log(variable)语句。这些日志可以通过右键单击地图并选择检查元素来查看。然后选择名为“Console”的第二个选项卡。 - the Hutt