我有以下数据和代码:
dd
  grp categ condition value
1   A     X         P     2
2   B     X         P     5
3   A     Y         P     9
4   B     Y         P     6
5   A     X         Q     4
6   B     X         Q     5
7   A     Y         Q     8
8   B     Y         Q     2
>
>
dput(dd)
structure(list(grp = structure(c(1L, 2L, 1L, 2L, 1L, 2L, 1L,
2L), .Label = c("A", "B"), class = "factor"), categ = structure(c(1L,
1L, 2L, 2L, 1L, 1L, 2L, 2L), .Label = c("X", "Y"), class = "factor"),
    condition = structure(c(1L, 1L, 1L, 1L, 2L, 2L, 2L, 2L), .Label = c("P",
    "Q"), class = "factor"), value = c(2, 5, 9, 6, 4, 5, 8, 2
    )), .Names = c("grp", "categ", "condition", "value"), out.attrs = structure(list(
    dim = structure(c(2L, 2L, 2L), .Names = c("grp", "categ",
    "condition")), dimnames = structure(list(grp = c("grp=A",
    "grp=B"), categ = c("categ=X", "categ=Y"), condition = c("condition=P",
    "condition=Q")), .Names = c("grp", "categ", "condition"))), .Names = c("dim",
"dimnames")), row.names = c(NA, -8L), class = "data.frame")


ggplot(dd, aes(grp,value, fill=condition))+geom_bar(stat='identity')+facet_grid(~categ)
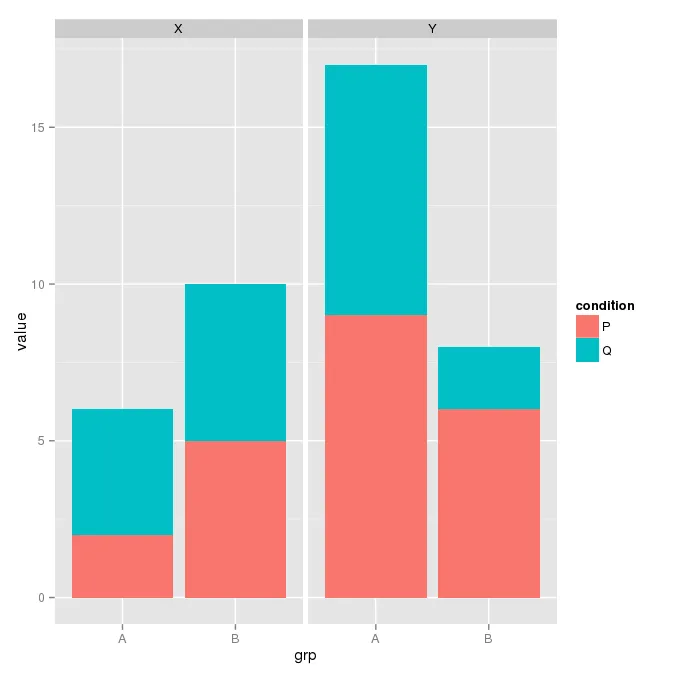
如何将此条形图转换为饼图?我希望在这里有4个饼图,它们的大小对应于相应条形的高度。我尝试了以下方法,但它们没有起作用:
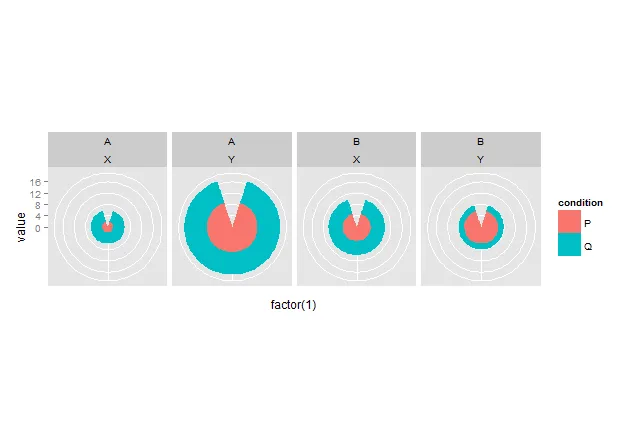
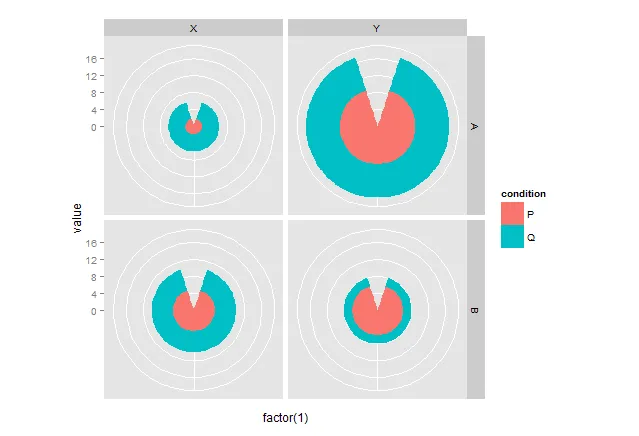
ggplot(dd, aes(grp,value, fill=condition))+geom_bar(stat='identity')+facet_grid(~categ)+coord_polar()
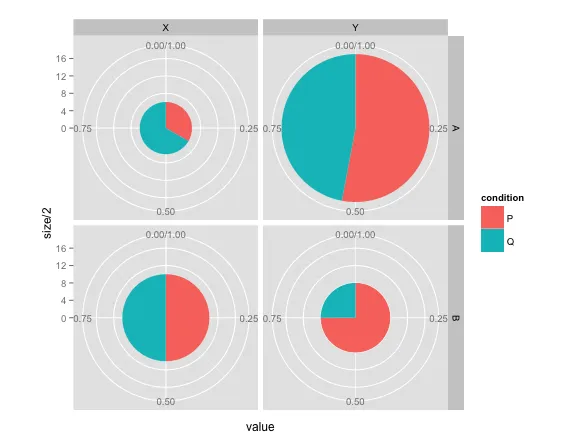
ggplot(dd, aes(grp,value, fill=condition))+geom_bar(stat='identity')+facet_grid(~categ)+coord_polar('y')
我也试图制作与ggplot2中可变饼图大小的饼图类似的饼图,但我无法处理我的数据。感谢您的帮助。