piRSquared的回答非常好,但它会删除所有与截断值以上相关性的列,这与R中的
findCorrelation的行为相比有些过头了。假设这些是机器学习模型中的特征,我们需要删除足够多的列,以使列之间的成对相关系数小于某个截断点(可能存在多重共线性等问题)。删除太多可能会对建立在这些数据上的任何模型造成损害。正如
Sergey Bushmanov在评论中提到的那样,在列
C和
H之间,只应该删除一个。
R的caret::findCorrelation的Python实现
R的caret::findCorrelation查看每个变量的平均绝对相关性,并删除每对列中具有最大平均绝对相关性的变量。下面的函数(名为findCorrelation)实现了完全相同的逻辑。
根据相关矩阵的大小,
caret::findCorrelation调用两个函数之一:完全向量化的
findCorrelation_fast或循环的
findCorrelation_exact(无论数据框大小如何,您都可以适当使用
exact=参数调用其中任何一个)。下面的函数执行完全相同的操作。
与
caret::findCorrelation唯一不同的行为是它返回列名的列表,而
caret::findCorrelation返回列的索引。我认为返回列名更自然,我们可以在以后传递给
drop函数。
import numpy as np
import pandas as pd

def findCorrelation(corr, cutoff=0.9, exact=None):
    """
    This function is the Python implementation of the R function
    `findCorrelation()`.

    Relies on numpy and pandas, so must have them pre-installed.

    It searches through a correlation matrix and returns a list of column names
    to remove to reduce pairwise correlations.

    For the documentation of the R function, see
    https://www.rdocumentation.org/packages/caret/topics/findCorrelation
    and for the source code of `findCorrelation()`, see
    https://github.com/topepo/caret/blob/master/pkg/caret/R/findCorrelation.R

    -----------------------------------------------------------------------------

    Parameters:
    -----------
    corr: pandas dataframe.
        A correlation matrix as a pandas dataframe.
    cutoff: float, default: 0.9.
        A numeric value for the pairwise absolute correlation cutoff
    exact: bool, default: None
        A boolean value that determines whether the average correlations be
        recomputed at each step
    -----------------------------------------------------------------------------
    Returns:
    --------
    list of column names
    -----------------------------------------------------------------------------
    Example:
    --------
    R1 = pd.DataFrame({
        'x1': [1.0, 0.86, 0.56, 0.32, 0.85],
        'x2': [0.86, 1.0, 0.01, 0.74, 0.32],
        'x3': [0.56, 0.01, 1.0, 0.65, 0.91],
        'x4': [0.32, 0.74, 0.65, 1.0, 0.36],
        'x5': [0.85, 0.32, 0.91, 0.36, 1.0]
    }, index=['x1', 'x2', 'x3', 'x4', 'x5'])

    findCorrelation(R1, cutoff=0.6, exact=False)  # ['x4', 'x5', 'x1', 'x3']
    findCorrelation(R1, cutoff=0.6, exact=True)   # ['x1', 'x5', 'x4']
    """

    def _findCorrelation_fast(corr, avg, cutoff):

        combsAboveCutoff = corr.where(lambda x: (np.tril(x)==0) & (x > cutoff)).stack().index

        rowsToCheck = combsAboveCutoff.get_level_values(0)
        colsToCheck = combsAboveCutoff.get_level_values(1)

        msk = avg[colsToCheck] > avg[rowsToCheck].values
        deletecol = pd.unique(np.r_[colsToCheck[msk], rowsToCheck[~msk]]).tolist()

        return deletecol


    def _findCorrelation_exact(corr, avg, cutoff):

        x = corr.loc[(*[avg.sort_values(ascending=False).index]*2,)]

        if (x.dtypes.values[:, None] == ['int64', 'int32', 'int16', 'int8']).any():
            x = x.astype(float)

        x.values[(*[np.arange(len(x))]*2,)] = np.nan

        deletecol = []
        for ix, i in enumerate(x.columns[:-1]):
            for j in x.columns[ix+1:]:
                if x.loc[i, j] > cutoff:
                    if x[i].mean() > x[j].mean():
                        deletecol.append(i)
                        x.loc[i] = x[i] = np.nan
                    else:
                        deletecol.append(j)
                        x.loc[j] = x[j] = np.nan
        return deletecol


    if not np.allclose(corr, corr.T) or any(corr.columns!=corr.index):
        raise ValueError("correlation matrix is not symmetric.")

    acorr = corr.abs()
    avg = acorr.mean()

    if exact or exact is None and corr.shape[1]<100:
        return _findCorrelation_exact(acorr, avg, cutoff)
    else:
        return _findCorrelation_fast(acorr, avg, cutoff)
你可以调用
findCorrelation来找到需要删除的列,并在数据框上调用
drop()来删除这些列(就像在R中使用这个函数一样)。
使用
piRSquared的设置,它返回以下输出。
corr = df.corr()
hc = findCorrelation(corr, cutoff=0.5)
trimmed_df = df.drop(columns=hc)
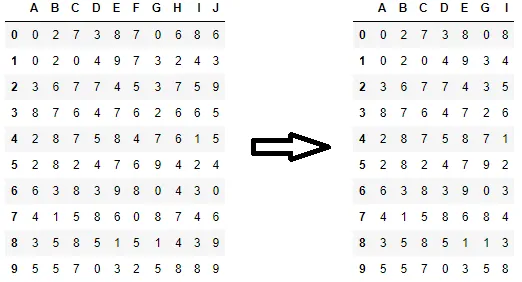
findCorrelation功能,可以删除除一个高度相关的列之外的所有列。干杯! - cottontail